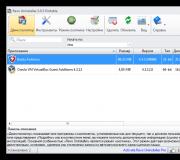
Windows Performance Monitor: collects system hardware load data.
Belarusian National Technical University
Faculty of Information Technologies and Robotics
Department of Computer Software
and automated systems
REPORT
for laboratory work No. 1
in the discipline: “Organization and functioning of computers”
on the topic: “System Monitor program.”
Completed by: Naidenik Yu.S.
Oshmyanko D.N.
Checked by: Novikov S.O.
Minsk 2005
Purpose of the work: become familiar with the System Monitor program and learn how to use it in practice.
Location:
To launch System Monitor, click the button Start and select teams Settings And Control Panel. In Control Panel, double-click Administration, and then double-click System Monitor. (You can start the System Monitor program by clicking Start, select team Execute and enter perfmon. msc.)
“System Monitor” is used to collect and view data on the current state of memory, disk, processor, network and other parameters in the form of a graph, histogram or report. The Performance Alerts and Logs component configures logs to record performance data and sets system alerts when a counter value is greater than, less than, or equal to a specified limit.
Understanding Performance Monitor
System Monitor allows you to measure the performance of your local computer and other computers on the network and has the following capabilities:
collection and viewing real scale time data about the performance of the local computer or remote computers;
viewing collected data, current or previously recorded counters in the log;
presentation of data in diagram form, histogram or report;
integration functionality into objects that support ActiveX controls, such as web pages, Microsoft Word, and other applications included in the suite Microsoft Office;
Creation HTML pages with performance data;
creating and saving configurations of monitoring settings that are installed on other computers using the MMC management console.
System Monitor allows you to collect and view large volumes data on the use of hardware resources and the activity of system services on administered computers. The following are the parameters that you can use to describe the required data.
Data type. To define the data collected, you must specify performance objects, performance counters And object instances. Some objects provide data about system resources, such as memory. Other objects provide data about application performance, such as system services or Microsoft applications BackOffice, executed by a computer.
Data source. System Monitor allows you to collect data from your local computer or other computers on the network if you have the appropriate permissions. (By default, this requires Administrative Computer permission.) You can also use current data or data previously recorded in counter logs.
Data sampling parameters. System Monitor supports the following data sampling modes: manual and automatic with a specified interval. When viewing log data, you can also set the start and end times to select a specific time interval.
In addition to the options that determine the content of the data, there are several options for viewing it in the System Monitor. The following are the available options.
chart or histogram title and vertical axis label;
the range of values displayed in a chart or histogram;
options for lines and columns showing counter values, including color, width, style, etc.
Display type. System Monitor supports displaying data in chart form, histograms and report. By default, chart mode is enabled, which has the largest range of customization options.
Display options. In any of the three data display modes, you can choose colors and fonts. In chart and histogram mode, you can set many additional display options, including:
The Alerts and Performance Logs component configures logs to record view data and sets system alerts when a counter value is greater than or less than a specified limit. The Alerts and Performance Logs snap-in provides tools for logging counters and event tracing, and generating alerts about performance changes. Counter logs allow you to record data about hardware usage and system service activity on local or remote computers. Logging can be done manually on demand or automatically based on a user-defined schedule. Continuous logging is also possible, limited in size file or time. Saved data can be viewed on the Performance Monitor screen or exported to a spreadsheet program or database for analysis and report generation. Trace logs record data about specific activity, such as disk communication or paging. When a specified event occurs, the provider sends data to the logging service. You can create a counter alert that sends a message, runs a program, or starts logging when a counter value reaches or exceeds a certain threshold.
Performance Monitor includes two consoles: System Monitor and Performance Logs and Alerts. Some servers place a shortcut to this application in the Administrative Tools folder of Control Panel Windows systems. Alternatively, this monitor can be launched in the utility SQL Server Profiler by selecting the menu item Tools ^Performance Monitor.
The very name of the program is Performance Monitor. Note that it can be misleading. PerfMon.exe is an application that came with previous versions operating system Windows. New monitor productivity is a full-fledged management console, and it would be more correct to call it that way, but for some reason Microsoft
decided to call this application a monitor, so we have no choice but to come to terms with it. You can learn more about this application in books dedicated to Windows XP.
System Monitor
System monitor, more precisely, the sysmon program. exe, is well known to anyone who has ever administered servers running the server version of Windows. The system monitor contains many counters that consolidate data about internal characteristics server. In a sense, it resembles a cardiograph monitor, but it measures the operating mode not of the human heart, but of the operating system and database server (Fig. 49.1).
Rice. 49.1. The System Monitor application can be useful for assessing overall SQL Server activity
Additional performance counters are added to the System Monitor one at a time by clicking the plus sign button on the toolbar. Performance counters can be installed on either a local or remote server; thus, it is not at all necessary to run this program directly on the database server computer. Counter readings can be displayed as line graph, histogram or real time.
All counters are organized by objects and sometimes by object instances. In the example shown in Fig. 49.1, The SQL Server: Databases object contains many counters, including a counter for the number of transactions processed per second. You can view this counter for all databases or just for selected instances.
Base core SQL data Server is far from the only supplier J Note: information for the system monitor - analysis and reporting services, .NET servers, ASP, BizTalk and many others add their counters to it.
Usually new counter appears as a straight line at the top or bottom of the chart because you need to zoom in to see it in more detail. In the program options dialog box, which opens using the Properties command context menu, you can adjust the scale of all graphs, the range of values of the selected counter and its presentation on the screen.
Although there are hundreds of system monitor counters available, Table 49.1 lists only the most popular of them, directly related to the SQL Server database server.
|
Table 49.1. Key performance monitoring counters |
Description |
Scope of application |
SQLServer:Buffer Manager |
Cache usage measure |
Percentage of reads performed from data cached in memory |
SQL Server usually does a good job of pre-caching data into memory. If the scores do not exceed 95%, then more memory can significantly improve performance |
CPU load measure |
Percent total load processor |
If the processor load is constantly above 60%, additional and faster processor cores can significantly affect performance |
SQLServer:SQL Statistics |
Number of batch requests per second |
SQL batch processing |
A good indicator of user activity |
Average disk queue length |
The total number of disk operations (reads and writes) waiting in the queue. This is an indicator of overall bandwidth disk, which is affected by the number of drives used in the RAID array. According to Microsoft, the length of this queue should not exceed the number of disks plus 2. (Be sure to check the scale when viewing this indicator.) |
Disk throughput is a key performance factor. Dividing the database into many disk subsystems may have a positive effect on performance |
|
Description |
Scope of application |
SQLServer:SQL Statistics |
Number of failures automatic settings parameters per second |
The number of queries for which SQL Server did not cache the execution plan in memory. This measure is an indicator of poorly written queries (remember to check scaling) |
Localizing and correcting poorly written queries improves performance |
SQLServer: Locks |
Average lock wait time (in milliseconds) |
May cause serious problems productivity. Lock wait times and the total number and magnitude of delays are good indicators of the quality of the locking policy used in the database |
If you are experiencing locking issues, you should double-check your index structure and transaction code. |
SQLServer:User Connections |
Number of user connections |
Current number of connections |
A good indicator of the potential value of a database |
SQLServer: Databases |
Number of transactions per second |
Current number of transactions per second |
Good indicator of database activity |
It should be noted that another indicator, SQLServer .-Wait Statistics, can help identify bottlenecks in the database server.
I Full list SQL Server counters and their current values can be found out S VS with P0M01 DYU dynamic presentation control sysdm_os_performance_ * I * counters. This is quite convenient because it allows you to obtain statistical * data directly in program code T-SQL.
You can create your own counters using T-SQL language and transfer data from the database to the system monitor. This can be useful for displaying transaction performance or the number of rows being inserted by the data generator. There are a dozen useful custom counters. In the next simple example the increment of the counter value is shown:
DECLARE @Counter Int SET @Counter = 0 While @Counter< 100 BEGIN
SET @Counter = @Counter + 1 EXEC sp_user_counterl @Counter WAITFOR Delay '00:00:02'
I use the system monitor to get an overall picture of the health of the database server and determine what issues I could potentially run into. Based on this information, I can use the SQL Profiler utility to get a more detailed look at the problem and solve it.
The system monitor configuration, including all counters, can be saved to a file by selecting File^Save As from the menu. If you need to restore this configuration information, you need to select File^Open from the menu. With this technology, you can export the system monitor configuration to other servers.
However, there is one subtlety. If the meter is monitoring local server, then on another server it will monitor the state of the local computer. If the meter is intended for monitoring remote server, then even if installed on another computer, it will monitor the same server, regardless of where the system monitor configuration file is opened. Since DBAs rarely work on the same computer as the SQL Server database, this can be a problem. If this problem will stand in front of you, send me an email at email- perhaps by that time I will write my own system monitor, in which I will solve this and many other problems.
Performance counter protocols
The Performance Monitor also includes a Performance Logs and Alerts plug-in, which includes Counter Logs, Trace Alerts, and regular alerts. In this section we will focus on the first of these components. Counter protocols use the same server counters as the system monitor, but instead of displaying them graphically on screen in real time, the data is logged. This means that the recorded data can be subsequently analyzed and even reproduced in the SQL Server Profiler utility (we will talk about this excellent tool in detail in the next section).
Performance logs configuration options are listed in the Counter Logs node of the Performance Monitor. To see the resulting files, just look in the output directory.
To create a new performance log, select New Log Settings from the context menu of the Counter Logs node. After entering the protocol name, the dialog box shown in Fig. 1 will open. 49.2, in which you can select the counters to be registered. Adding a new object causes all counters for it to be listed; at the same time, you can manually change their composition for more precise purposes, similar to what is done in the system monitor.
Meter protocols can be scheduled; they can be started and stopped manually from the Log context menu or using the corresponding toolbar buttons.
If protocol creation was defined as text file delimited, you can open it with Excel programs. Each column represents a sequence of readings of some counter, and each row is a collection of readings from one sample.
Undocumented and little-known features Windows XP Klimenko Roman Aleksandrovich
System Monitor
System Monitor
After entering in command line Run commands perfmon.msc console Microsoft management accesses the contents of the registry branches HKEY_CURRENT_USERSoftwareMicrosoftSystemMonitor and HKEY_LOCAL_MACHINESOFTWAREMicrosoftWindows NTCurrentVersionPerflib, the parameters of which will be discussed a little later. After entering the command, you will see the Performance console window open on the System Monitor ActiveX object (Fig. 11.1).
Rice. 11.1. Console Window Performance
Using the System Monitor ActiveX object, you can monitor the operation of any equipment installed on your computer in real mode time. At the same time, there are many parameters of equipment operation that can be viewed (using so-called counters).
The Performance Monitor window consists of three areas - the Performance Monitor toolbar area (located at the top of the console and contains a set of buttons quick access), an area for displaying device performance results (middle area), and a counter area that is being monitored (located at the bottom of the console).
From the book Computer and Health author Balovsyak Nadezhda VasilievnaSystematic approach Parents often do not systematize how a child learns a computer and leave it to the latter to choose from, who exchanges game discs with peers and best case scenario listens to music or surfs children's sites. As a result, the child may be
From the book Assembling a computer with your own hands author Vatamanyuk Alexander IvanovichMonitor A monitor is a device that is used to display text and graphic information, coming from the video card. Today, two types of monitors are most common: with cathode ray tube(CRT monitors) and liquid crystal display (LCD monitors). When
From the book PC Hardware [Popular tutorial] author Ptashinsky VladimirMonitor Monitors rarely break down and usually as a result of natural aging. Most often, picture tubes or input power circuits suffer. Repairing a monitor is a labor-intensive process and is not always possible at home. For example, you can repair the LCD display yourself
From the book Video Editing Tutorial home video at Adobe Premiere Pro CS3 author Dneprov Alexander GSystem unit As Anton Pavlovich Chekhov used to say: “Everything in a person should be beautiful: face, clothes, soul, and thoughts.” To paraphrase the words of a classic, we dare to say that everything in a computer should be functional: the monitor, the case, and motherboard, And
From the book Pinnacle Studio 11 author Chirtik Alexander AnatolievichMonitor Interface Premiere programs Pro contains many components - windows, palettes, toolbars, so for ease of use it is recommended to use a monitor with large size diagonally and therefore high resolution. This does not necessarily mean
From the book Newest tutorial working on a computer author Beluntsov ValeryMonitor To work with Pinnacle Studio 11 you will need a monitor with a resolution of at least 1024? 768 (as opposed to previous version, for which the minimum resolution is 800? 600). At a lower resolution, stripes will be visible around the edges of the program window
From the book Internet - easy and simple! author Alexandrov EgorSystem unit The main parts of the computer responsible for its operation are located in system unit(Fig. 1.8). Externally, it usually looks like a rectangular box, the front panel of which standard case there are power on and reset buttons and two multi-colored
From the book Doubling Sales in an Online Store author Parabellum Andrey AlekseevichMonitor In order for the user to see the result of the computer's operation, a device is needed to display information. IN modern computers as a rule, it is a monitor, although there may be others (printer, plotter, etc.). Almost all the information with which
From the book Home computer author Kravtsov RomanMonitor In general, they don’t skimp on health. If your vision is valuable to you, then spare no expense in purchasing it. quality monitor(Fig. 2.2), otherwise it could cost you much more later. Rice. 2.2. Monitor. Most sites are now adapted to a resolution of 800x600, but it has become
From the book Undocumented and Little-Known Windows features XP author Klimenko Roman AlexandrovichA systematic approach to the USP Clear presentation of information and clarity of thought when drawing up a unique selling proposition is not everything. They may not give the expected effect. The USP must be formed in such a way as to influence not only the reasonable perception of the client
From the book Computer is easy! author Aliev ValerySystem unit It's no secret that among buyers of new computers there are not so many people who seriously think about why they are buying it? But in vain! Only by correctly outlining the circle of your real needs can you with sufficient accuracy
From the book Development Linux kernels by Love RobertSystem Monitor After entering the command line Run perfmon.msc command, the Microsoft Management Console accesses the contents of the registry branches HKEY_CURRENT_USERSoftwareMicrosoftSystemMonitor and HKEY_LOCAL_MACHINESOFTWAREMicrosoftWindows NTCurrentVersionPerflib, the parameters of which will be discussed a little later. After entering
From the book How to Tame Your Computer in a Few Hours author Remneva IrinaSystem block The system block is the information processing block. It is interesting to us because it is on it that the button, or key, for turning on the computer is located. It should be noted that there are also other quite important devices, such as: disk drive for
From the author's bookSystem Timer The system timer plays a more significant role in keeping track of the passage of time by the kernel. Regardless of the hardware platform, the idea behind the system timer is the same - it provides a mechanism for managing interrupts that
From the author's bookSystem unit This is usually a metal box, large or not very large. You may be surprised, but this is the most important component of a computer (in principle, this is a computer). Outside this box (on its front part) there is a very important thing - a power button
From the author's bookMonitor Externally it resembles a TV. Therefore, the dimensions of the monitor are also the same as regular TVs, - is determined by the length of the screen diagonal in inches - 15, 17, 19, 21 (by the way, one inch is equal to 2.54 cm). Just as a DVD player without a TV is just a box, so
Introduction to monitoring systems.
Let's consider monitoring tools: Console Performance and Network Monitor
Console Performance.
To launch the Productivity console, open the Administrative Tools folder in Control Panel and select the Performance.
The Productivity Console is actually two tools:
- System Monitor snap-in,
- Standalone Performance Logs and Alerts snap-in - to view monitoring log files.

Equipment System Monitor.
With the Performance Monitor snap-in, you can measure the performance of your computer or other computers on the network:
- Collect and view current system performance data on local computer or on multiple remote computers.
- View current data or data previously collected using the Performance Logs and Alerts snap-in.
- Present data in the form of a graph, histogram, or report that can be printed.
- Implement opportunities System Monitor V Microsoft Word or other applications Microsoft package Office using OLE automation.
- Create HTML pages to view performance.
- Create monitoring configurations that allow reuse, which can be installed on other computers using the MS Management Console
Objects and performance counters.
Windows XP gets performance information from computer components. System components generate performance data as they operate. These components are called performance objects.
The OS has a number of performance objects, usually corresponding to major hardware components such as memory, processors, etc. Applications can also install their own performance objects.
Each performance object provides counters that collect performance data. For example, the Pages Exchanged/sec counter of the Memory object tracks the extent to which pages are cached.
The objects that are most often used to track the operation of system components are:
- logical drive;
- physical disk;
- memory;
- flow;
- process;
- CPU;
- system;
- swap file;
In Windows XP the object Physical disk is enabled by default, and the object Logical drive disabled by default. To enable counters for monitoring logical drives or volumes you need to run the command in the console diskperf -yv and reboot the system.
To see an explanation of what data a particular counter provides, click the Explain button in the Add Counters dialog box, which you can access by clicking the plus icon on the snap-in toolbar.

Some objects (such as Memory and Server) have only one instance, although other performance objects can have multiple instances. If an object has multiple instances, you can add counters to track statistics for each instance or for all instances at the same time.
For example, if the system has several processors installed, then the object CPU will have many copies. Moreover, if an object supports multiple instances, then when the instances are combined into a group, there will be a parent instance and child instances that will belong to that parent instance.
Setting up counters.
When you select the System Monitor snap-in, a graphing window will open by default in the results pane. Steps to add counters:
If you do not have the appropriate permissions to monitor your computer, you will receive an error message. The counter will be indicated on the histogram, but no data will be displayed.
If the counter that you want to monitor is not on the screen, it is possible that the service or element that is the counter object is not installed or enabled on this computer, and you should add this service first.
You can place the System Monitor control in Microsoft document Word. To do this:
- Open Word document and place the cursor at the location where the control is supposed to be placed.
- From the View menu, select Toolbars -> Controls.
- Click the More Items button and select the System Monitor Control option from the list.
- The System Monitor graph will be inserted into specified place in the document. IN at the moment the element is in design mode so you can work with it in the editor Visual Basic.
- To change settings or add counters, click the Exit Design Mode button to exit Design Mode.
- To add counters to the chart, click on it right click mouse and select Add counters from the context menu.
Settings appearance.
The System Monitor snap-in provides three viewing tools for performance information: two graphical (Graph and Histogram) and one textual (Report). To customize the appearance of the monitoring window, right-click the graph and select Properties from the context menu. In the window that opens, you can set a series for the graph and histogram additional parameters display:
- name of the graph or histogram and coordinate axes;
- value output range;
- characteristics of a curve on a graph or bars on a histogram, such as color, thickness, style, etc.
On the tab General You can specify the required type of monitoring tool. By default the option is selected Schedule. You can also display performance data as a bar graph or report.
Working with the System Monitor snap-in.
When monitoring your system, keep a few things in mind: useful rules, which will allow you to use system resources most efficiently:
- Determine the configuration of monitoring tools. To track work Windows installations XP, you can view data as a graph using Performance Monitor, or collect data in performance logs for viewing and analysis in other applications. Configure the Alerts and Performance Logs snap-in to collect data from selected counters at specified intervals. The resulting data logs can be used to generate reports and analyze overall system performance, as well as plan future upgrades.
- Keep the resources required for monitoring low. Monitoring tools configured for consumption minimum quantity resources. However, in some cases it is necessary to take additional measures to reduce it. Presentation of performance data in the System Monitor window in the form of a graph, frequent data sampling, large number monitored objects and counters - all of which increase the amount of resources spent on performance monitoring.
- Analyze performance data and establish a performance baseline. It is generally useful to establish a performance baseline for a typical workload. This can be done by outputting the data to graphical form in the System Monitor window.
- Setting up alerts. Set to generate alerts when counter values exceed acceptable values.
- Performance tuning. Use performance data to tune system settings for optimal handling of system load.
- Planning. Monitor trends in server load changes and the need to upgrade the system hardware.
Choosing a monitoring method.
For current monitoring of system operation in real time on a local or remote computer, it is convenient to use graphs. Snap-in logs Performance logs and alerts are useful for recording entries. The logged data can be used to generate reports and presented as graphs or histograms using System Monitor.
Selecting the recording frequency.
Care should be taken when choosing the frequency and duration of data logging because frequent updates data leads to the generation of a very large amount of data that will be difficult to work with. This may also result in increased performance overhead for running the Performance Logs and Alerts snap-in.
IN general case The frequency of data updates depends on the length of the logging interval. If the registration interval is 4 hours, then it is recommended to install the update every 15 seconds. For an 8-hour logging interval, select a refresh period of at least 300 seconds (5 minutes). In general, for continuous monitoring, the interval is set to 15 minutes.
Selection of counters.
Monitoring should begin by tracking the following four components in this order:
- Memory.
- Processors.
- Disks.
- Net.
The table below shows minimum set counters that should be used to monitor the server. As you work, you can add additional counters for the performance objects you are interested in.
Component | Parameter under study | Counters |
Selecting the computer that will be used for monitoring.
When monitoring remote computers, several options for collecting data are possible. For example, you can run Performance Logs and Alerts on an administrative computer and display data from all remote computers. Or you can start a data collection service on each computer and run it at regular intervals batch program to transfer data to the administrator’s computer for subsequent analysis and archiving.
Centralized data collection (collecting data from all remote computers on the local computer) is the easiest to implement. Collecting data from multiple systems can be recorded in a single log file, but this increases network traffic and requires more memory on the administrator's computer.
Distributed data collection (that is, data collection conducted on each monitored computer) does not increase traffic and does not require additional memory on the administrator's computer. However, the transfer of data to the administrator's computer will occur with a certain delay.
Performance data analysis.
Analysis of monitoring results includes checking meter readings recorded during system execution various operations. During this process, you should identify the most active processes and also identify programs or threads that are exclusively using any resources. As a result, you must figure out how your system handles the workload.
As part of this analysis, you should determine the level of system performance when a typical workload is being processed and all necessary services which is called basic level. The base standard is determined by the administrator based on the workload. This level is determined based on a number of performance counters and represents the state of the system when it satisfactorily handles all user requests.
Determining acceptable meter readings.
In general, determining an acceptable level of performance is a rather subjective decision. However, the table below provides limit values for a number of meters to help you determine if your meter readings indicate a problem. If the meter readings remain consistently at the maximum level, then there is every reason to talk about the presence of a bottleneck in the system, and measures should be taken to configure or upgrade the loaded resource.
Limit meter readings:
Object\counter | Limit level |
@ECHO OFF ECHO Adding counter "New_counter"... rem Create new group data collectors logman create counter New_counter -f bincirc -c ^ "\Processor(_Total)\%% Processor Time" ^ "\Memory(_Total)\Page/sec" ^ "\Memory(_Total)\%% Uncommited Bytes In Use" ^ "\Memory(_Total)\Available Bytes" ^ "\System(_Total)\Processor Queue Length" ^ "\PhysicalDisk(_Total)\Avg. Disk Queue Lenghth" ^ "\PhysicalDisk(*)\Avg. Disk Queue Lenghth" ^ "\Network Interface(*)\Bytes Total/sec" ^ -si 15 -v mmddhhmm rem Launch the performance monitor C:\Windows\System32\Perfmon.exe ECHO done
Counter names are enclosed in quotation marks and separated by a space. The names of the counters can be written both in English and in Russian (but then the bat file will only work in Russian-language Windows versions). If the meter name contains the sign % , it must be replaced by signs %% (double percentage).
Having completed this file, we will immediately be taken to the performance monitor, where we will see a newly created data collector group named New_counter.

The counters described are usually sufficient for overall assessment system load. Other counters are used to investigate problems in detail if it is determined that there is a problem lack of productivity equipment.
Did this article help you?