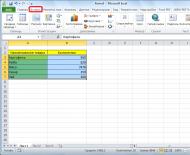
In many Excel documents, information that is presented in table form is much easier to understand and analyze if it is displayed as...
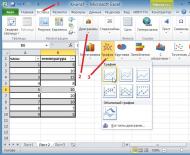
In Excel, graphs are made to visually display data that is recorded in a table. Before you can draw a graph in Excel, you must have created and...
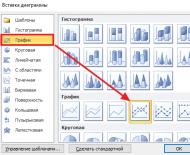
Microsoft Excel offers the ability not only to work with numerical data, but also provides tools for constructing based on...

Charts help present numerical data in a graphical format, making large amounts of information much easier to understand. Also, with...
If your Word document has a lot of tabular data, then you can visualize it using graphs. Material with graphics will be more visual and...
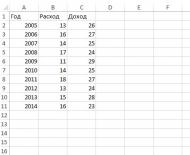
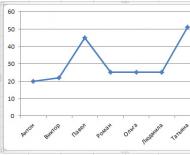
Among the many features Microsoft Excel provides, the line graph function is especially useful. Here, we provide you with an example of it...