Download the construction work schedule table. Planning of design work
It's important to make a plan. The plan must not only be beautiful in order to attach it to the contract, but also executable, detailed, with milestones, and stages.
Schedule details
The best way to eat an elephant is piece by piece. Great job scary and demotivating. Both the customer and the contractor feel calm and confident if the work is divided into stages so small that no one doubts their feasibility.
For each item of the plan, those responsible on the part of the customer and on the part of the contractor, the deadlines, and the number of man-hours to complete the item must be indicated. It is useful to include the number of man hours in the plan to justify the cost of work. Some points may depend on others, then it is useful to indicate this. For example, write: “Executes after point 10.” This will be useful if you need to adjust the plan.
Time to clarify the task, present and accept the results, correct comments.
The plan must include points to clarify tasks, negotiate with the customer, transfer results, receive comments, and correct them. From experience, communication with the customer often takes 25% of the time, and sometimes all 50%.
Checkpoints
It is very bad if the plan does not have control points. Most people tend to put off everything until the last minute. A plan without milestones is often started the day before the work is due. Checkpoints You need to arrange them evenly so that you constantly have an idea of progress in fulfilling what was planned.
Actions of both the customer and the contractor
The plan must include not only the obligations of the contractor, but also the actions of the customer. Firstly, this will draw the customer’s attention to the fact that the timely implementation of the plan also depends on him. Secondly, this will allow us to fight off the customer’s claims regarding deadlines, if the violation of deadlines was due to the fault of the customer.
Adjustment of the plan
During the work process, unforeseen changes, delays, changes in the scope of work, etc. may occur. All changes must be documented in additional agreements to avoid any claims. Even if the relationship with the customer’s manager is ideal, and he never goes back on his words, the manager may change, and it will be very difficult for a new person to prove something without written evidence. Documenting changes is very easy to start from the very beginning of the project. This is the procedure, we always do this. It's simple and clear. In the middle of a project, moving from verbal to written agreements is much more difficult, and sometimes even impossible. A legitimate question arises: What is it all of a sudden, everything was decided orally, and then some papers appeared? So be sure to have clear documentation from the start. Changes to the plan can be documented, for example, by minutes of meetings at which the corresponding decision is made, signed by both parties.
Example of a service (work) schedule
Development of a power source for a radio-electronic device.
| N | (1) | (2) | (3) | (4) | (5) | (6) |
| 1. | Clarification of requirements for power supply (PS) | SZ1/ SI1 | 01.06.2006 | 40 | Terms of reference (TOR) for individual entrepreneurs, payment for the development of TOR | |
| 1.1. | Holding a meeting between the contractor’s and the customer’s employees | SZ1/ SI1 | 01.05.2006 | 4 | Primary requirements for individual entrepreneurs | |
| 1.2. | Processing of primary requirements, preparation of the first version of technical specifications. Direction to the customer. | SI1 | 10.05.2006 | 20 | First version of technical specifications | Executed after step 1.1. |
| 1.3. | Preparation of comments by the customer, collection of comments by the contractor | SZ1/ SI1 | 20.05.2006 | 6 | List of customer comments | Executed after step 1.2. |
| 1.4. | Summarizing the customer’s comments, making changes to the technical specifications, providing the final version. | SI1 | 25.05.2006 | 10 | Final version of technical specifications | Executed after step 1.3. |
| 1.5. | Approval by the customer of the final version of the technical specifications, signing of the Act for the first stage. | SZ0 | 28.05.2006 | Approved technical specifications, signed Act for the first stage | Executed after step 1.4. | |
| 1.6. | Invoicing for work on the first stage. | SI2 | 28.05.2006 | Invoice for payment of the first stage | Executed after step 1.5. | |
| 1.7. | Payment for the first stage. | SZ0 | 01.06.2006 | Statement of receipt of money on account | Executed after step 1.6. | |
| 2. | Calculation of mass-dimensional characteristics of IP | SI3 | 10.06.2006 | 20 | Weight and dimensions characteristics of IP | Executed after step 1. |
| ... | ||||||
| N0. | Signing of the act for the entire scope of work | SZ0 | 10.02.2007 | Certificate of completed work for the entire project | Executed based on the results of the project | |
| N1. | Issuing invoices for the entire project | SI2 | 12.02.2007 | Invoice for the entire project | Executed after n N0 | |
(1) - The essence of the work. Description of work at the stage. (2) - Responsible on the part of the customer / Responsible on the part of the contractor. (3) - The deadline by which the work must be completed. (4) - The number of man-hours of the performer to complete the stage. (5) - The results of the stage, which can be used to check that the stage is completed. (6) - Notes, information about the dependencies of stages.
Unfortunately, errors are periodically found in articles; they are corrected, articles are supplemented, developed, and new ones are prepared.
Let's imagine the situation of developing a capital construction project at a manufacturing enterprise. The project has been successfully initiated and planning work is in full swing. Formed and approved, the milestone plan has been adopted. Primary version developed calendar plan. Since the task turned out to be quite large-scale, the curator decided to develop also network model. Calculation network graphics in the applied aspect of its execution is the subject of this article.
Before starting the simulation
The methodological basis of network project planning is presented on our website in several articles. I will just refer to two of them. These are materials devoted in general and directly. If during the course of the story you have questions, review the previously presented understandings; the main essence of the methodology is outlined in them. In this article we will look at small example local part of the complex of construction and installation works as part of a significant project implementation. We will perform calculations and modeling using the “vertex-work” method and the classic tabular method (“vertex-event”) using the MKR (critical path method).
We will begin constructing the network diagram based on the first iteration of the calendar plan, made in the form of a Gantt chart. For clarity purposes, I propose not to take precedence relations into account and simplify the sequence of actions as much as possible. Although this rarely happens in practice, let’s imagine in our example that the operations are arranged in a “finish-start” sequence. Below you will find two tables: an extract from the list of project works (a fragment of 15 operations) and a list of network model parameters necessary for presenting formulas.
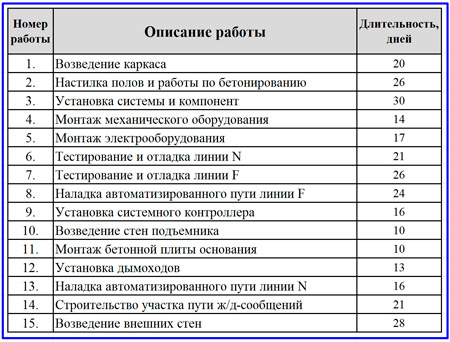
An example of a fragment of a list of operations of an investment project
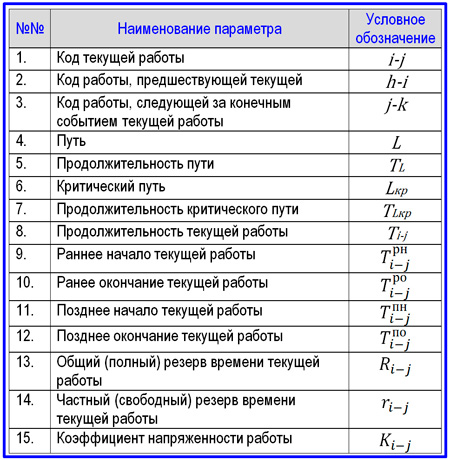
List of network model parameters to be calculated
Don't be intimidated by the abundance of elements. Building a network model and calculating parameters is quite simple. It is important to prepare thoroughly, have a hierarchical structure of work at hand, line graph Gantt - in general, everything that makes it possible to determine the sequence and relationships of actions. Even the first time you run a graph, I recommend having formulas for calculating the required values in front of you. They are presented below.
![]()
Formulas for calculating network diagram parameters
What do we need to determine when constructing the graph?
- An early start to ongoing work that includes multiple connections from previous operations. We select the maximum value from all early endings of previous operations.
- Late ending of the current activity from which multiple links exit. Choose minimum value of all the late starts of follow-up.
- The sequence of activities that form the critical path. For these actions, early and late starts are equal, as are early and late finishes, respectively. The reserve for such an operation is 0.
- Full and private reserves.
- Work intensity coefficients. We will consider the logic of the formulas for reserves and the work intensity coefficient in a special section.
Sequence of modeling actions
Step one
We begin constructing a network diagram by placing task rectangles sequentially from left to right, applying the rules described in previous articles. When performing modeling using the “vertex-work” method, the main element of the diagram is a seven-segment rectangle, which reflects the parameters of the beginning, end, duration, time reserve and name or number of operations. A diagram of its parameters is shown below.

Diagram of the work image on the network diagram
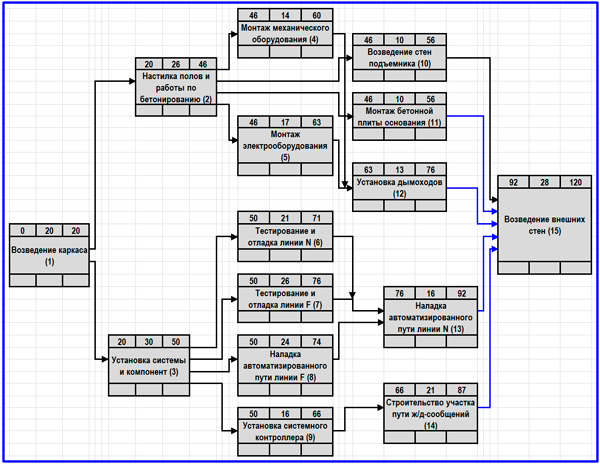
The result of the first stage of constructing a network diagram
According to the logic of the sequence of operations using specialized program, MS Visio or any editor, we place images of work in the format specified above. First of all, fill in the names of the actions to be performed, their numbers and duration. We calculate the early start and early end taking into account the formula for the early start of the current action in the conditions of several incoming connections. And so we go until the final fragment of the operation. At the same time, in our example project, the same Gantt chart does not provide for outgoing connections from operations 11, 12, 13 and 14. It is unacceptable to “hang” them on the network model, so we add fictitious connections to the final work of the fragment, highlighted in blue in the figure.
Step two
Finding the critical path. As you know, this is the path that has the longest duration of the actions that are included in it. Looking through the model, we select connections between activities that have maximum early termination values for activities. The designated critical path is highlighted with red arrows. The result obtained is presented in the intermediate diagram below.
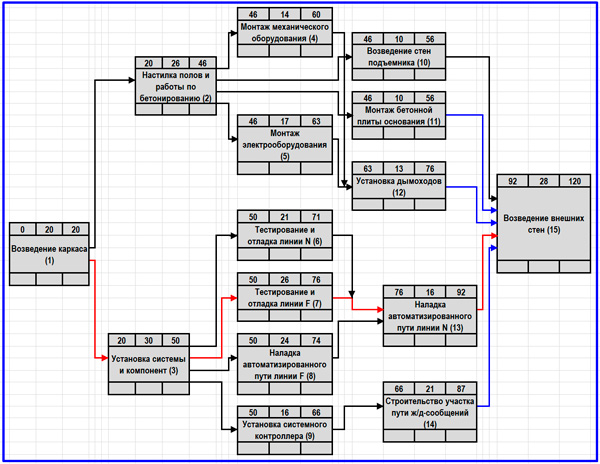
Network diagram with a highlighted critical path
Step three
Fill in the values for late finish, late start and full work reserve. To perform the calculation, we go to the final work and take it as the last operation of the critical path. This means that the late end and start values are identical to the early ones, and from last operation fragment we begin to move into reverse side, filling in the bottom line of the action diagram. The calculation model is shown in the diagram below.
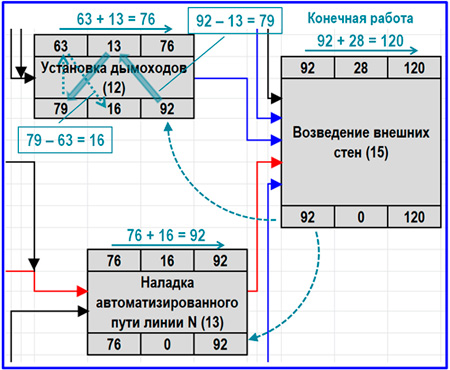
Scheme for calculating late starts and finishes outside the critical path
![]()
The final view of the network diagram
Step four
The fourth step of the network modeling and calculation algorithm is the calculation of reserves and tension coefficient. First of all, it makes sense to pay attention to the total reserves of paths of non-critical directions (R). They are determined by subtracting from the duration of the critical path the time duration of each of these paths, numbered on the final network diagram.
- R path number 1 = 120 – 101 = 19;
- R path number 2 = 120 – 84 = 36;
- R of path number 3 = 120 – 104 = 16;
- R path number 4 = 120 – 115 = 5;
- R path number 5 = 120 – 118 = 2;
- R path number 6 = 120 – 115 = 5.
Additional model calculations
The calculation of the total float of the current operation is carried out by subtracting the early start from the late start value or the early finish from the late finish value (see the calculation diagram above). The general (full) reserve shows us the possibility of starting the current work later or increasing the duration by the duration of the reserve. But you need to understand that you should use the full reserve with great caution, because the work that is farthest from the current event may end up without a reserve of time.
In addition to full reserves, network modeling also operates with private or free reserves, which represent the difference between the early start of subsequent work and the early completion of the current one. The private reserve shows whether it is possible to move the earlier start of the operation forward without affecting the start of the next procedure and the entire schedule. It should be remembered that the sum of all partial reserve values is identical to the total reserve value for the path in question.
The main task of performing calculations various parameters is to optimize the network schedule and assess the likelihood of completing the project on time. One of these parameters is the tension coefficient, which shows us the level of difficulty in completing the work on time. The coefficient formula is presented above as part of all calculation expressions used to analyze the network diagram.
The tension coefficient is defined as the difference between one and the quotient of the total reserve operating time divided by the difference between the duration of the critical path and the special design value. This value includes a number of segments of the critical path that coincide with the maximum possible way, to which the current operation (i-j) can be attributed. Below is the calculation of private reserves and work intensity factors for our example.
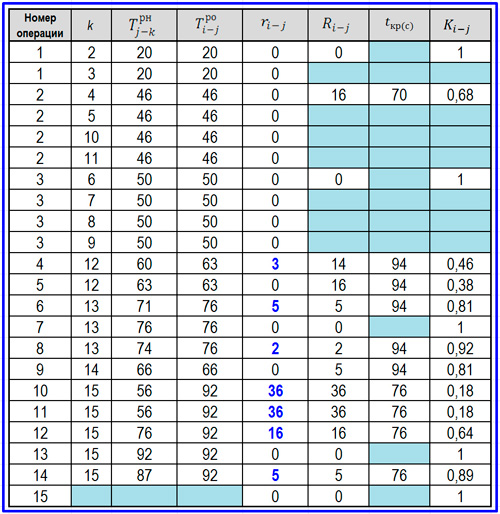
Table for calculating private reserves and tension coefficient
The tension coefficient varies from 0 to 1.0. A value of 1.0 is set for activities on the critical path. The closer the value of a non-critical operation is to 1.0, the more difficult it is to stay on schedule for its implementation. After the coefficient values for all chart actions are calculated, operations, depending on the level of this parameter, can be categorized as:
- critical zone (Kn more than 0.8);
- subcretic zone (Kn more than or equal to 0.6, but less than or equal to 0.8);
- reserve zone (Kn less than 0.6).
Optimization of the network model, aimed at reducing the overall duration of the project, is usually achieved by the following activities.
- Redistribution of resources in favor of the most stressful procedures.
- Reducing the labor intensity of operations located on the critical path.
- Parallelization of critical path activities.
- Redesign of the network structure and composition of operations.
Using the table method
Well-known scheduling software (MS Project, Primavera Suretrack, OpenPlan, etc.) are capable of calculating key parameters of the project network model. We are in this section tabular method Let's set up such a calculation using standard MS Excel tools. To do this, let’s take our example of a fragment of project operations in the field of construction and installation work. Let's arrange the main parameters of the network diagram in the columns of the spreadsheet.
![]()
Model for calculating network diagram parameters in a tabular way
The advantage of performing calculations in a tabular manner is the ability to easily automate calculations and avoid a lot of errors associated with the human factor. We will highlight in red the numbers of operations located on the critical path, and in blue we will mark the calculated positions of private reserves exceeding the zero value. Let us analyze step by step the calculation of network diagram parameters for the main positions.
- Early starts of operations following current work. We configure the calculation algorithm to select the maximum value from the early end time of several alternative previous actions. Take, for example, operation number 13. It is preceded by operations 6, 7, 8. Of the three early finishes (71, 76, 74, respectively), we need to select the maximum value - 76 and set it as the early start of operation 13.
- Critical path. Carrying out the calculation procedure according to point 1 of the algorithm, we reach the end of the fragment, finding the value of the duration of the critical path, which in our example was 120 days. The highest early completion values among the alternative actions indicate operations on the critical path. We mark these operations in red.
- Late finishes of activities preceding the current job. Starting from the end work, we begin to move in the opposite direction from actions with higher numbers to operations with lower numbers. In this case, from several alternatives for outgoing work, we choose the least knowledge of the late start. Late starts are calculated as the difference between the selected values of late finishes and operation durations.
- Operation reserves. We calculate total (total) reserves as the difference between late starts and early starts or between late finishes and early finishes. The values of private (free) reserves are obtained by subtracting the early start of the next operation from the early end of the current one.
We examined practical mechanisms for drawing up a network schedule and calculating the main parameters of the project's time duration. Thus, we have come close to exploring the possibilities of analysis carried out with the aim of optimizing the network model and directly forming an action plan to improve its quality. This topic takes up little space in the project manager’s body of knowledge and is not that difficult to understand. In any case, each PM must be able to reproduce the visualization of the graph and perform the accompanying calculations at a good professional level.
The module for planning and monitoring the execution of design work is designed to solve the following tasks:
1. Formation of schedules for the implementation of design work based on the use of previously completed design solutions, or based on a library of standard design solutions, or by directly entering information;
2. Formation of options for correcting implementation schedules when assessing the possibility of concluding a new contract (change or postponement of design deadlines based on an assessment of the workload of departments, the importance and complexity of design objects);
3. Assessment of the calendar load of departments and the organization as a whole, with the determination of the share of the projects being executed;
4. Formation of reports on completed and overdue work in the context of customers, GIPs, departments, etc.;
5. Monitoring the execution of design work with the ability to identify and track critical paths.
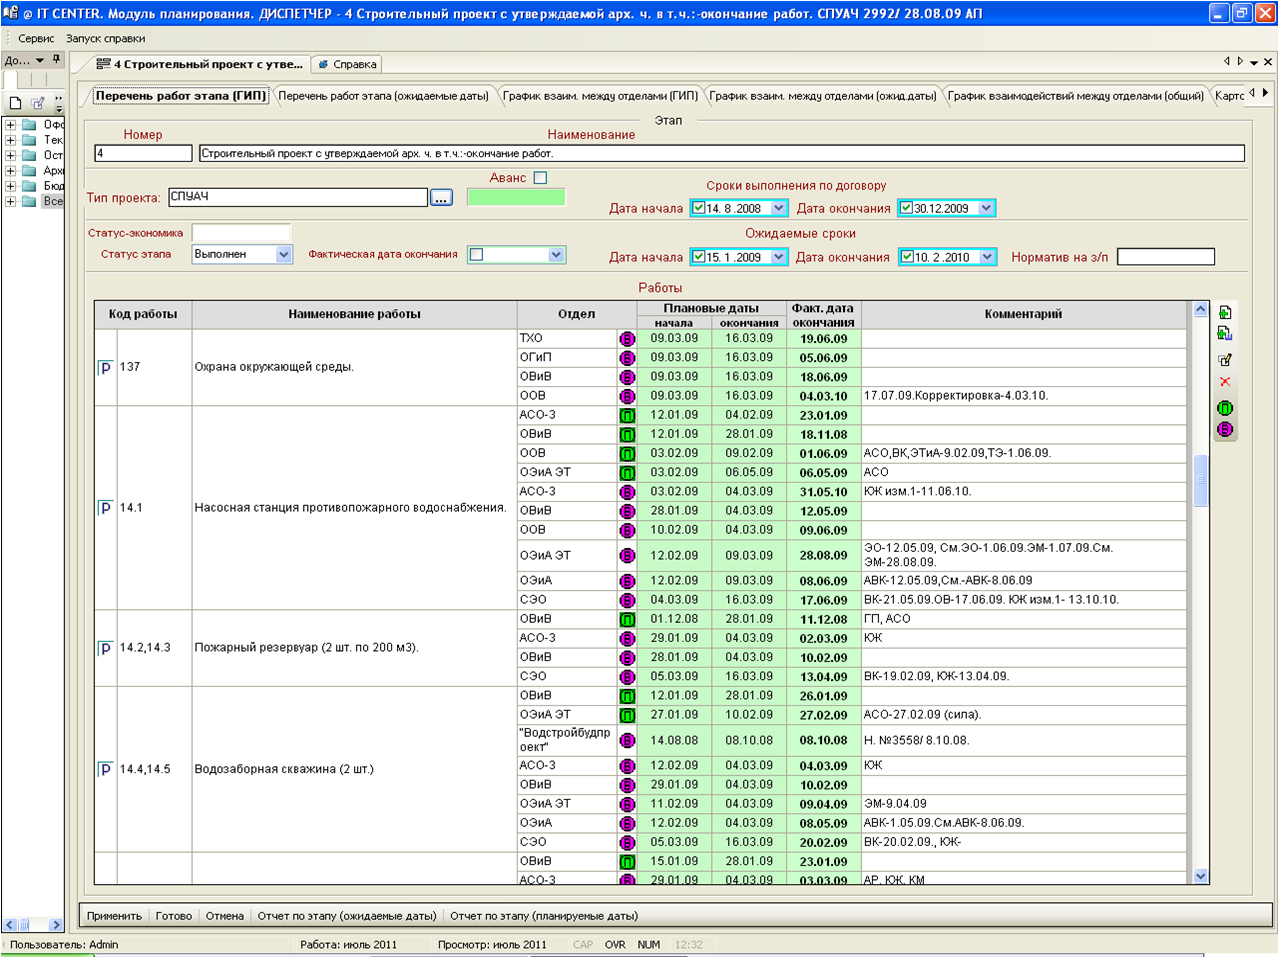
Before starting to conclude a contract and work on the project, the chief executive officer or the head of the department has the opportunity to first draw up a work schedule, coordinate it with the departments, assess the workload of the departments, and determine the possible completion date of the project. This information will then be used to monitor the progress of project work.
Creating and editing charts is possible as in graphical form(see figure above) and in the table. The system has the ability to take into account connections between separate works(related work) with the possibility of subsequent coordination of the transfer of tasks to related departments. To control the execution of work, the system provides the possibility of using the dispatcher’s workplace or direct marks of completion by the performers.
If for some reason there is a failure to meet the deadlines for project work, you can determine the reason and the contractor and, if necessary, adjust the progress of work on the project.
When applied financial information According to contracts (stages), you can get a picture of the calendar workload of the enterprise as a whole or individual divisions for the period of interest.
All information from the module for planning and monitoring the execution of design work is available to the management of the enterprise in the form of reports and graphs.
The presented materials are a selection of settings for various design organizations. All screen forms, reports are customized for workplaces, taking into account the specifics of design technology and the structural composition of a particular organization. Therefore, consider the above from the point of view of information content and the fundamental capabilities of the system.
The system allows you to draw up a schedule for completing work under a contract, by stage, by additional agreement. The schedule may include work, tasks, milestones, stages, etc. For each of them, the participating units are indicated: who transfers to whom, the deadlines for completing the work.
The schedule is initially drawn up in the table:
Based on the data from the table, the program generates a Gantt chart:
![]()
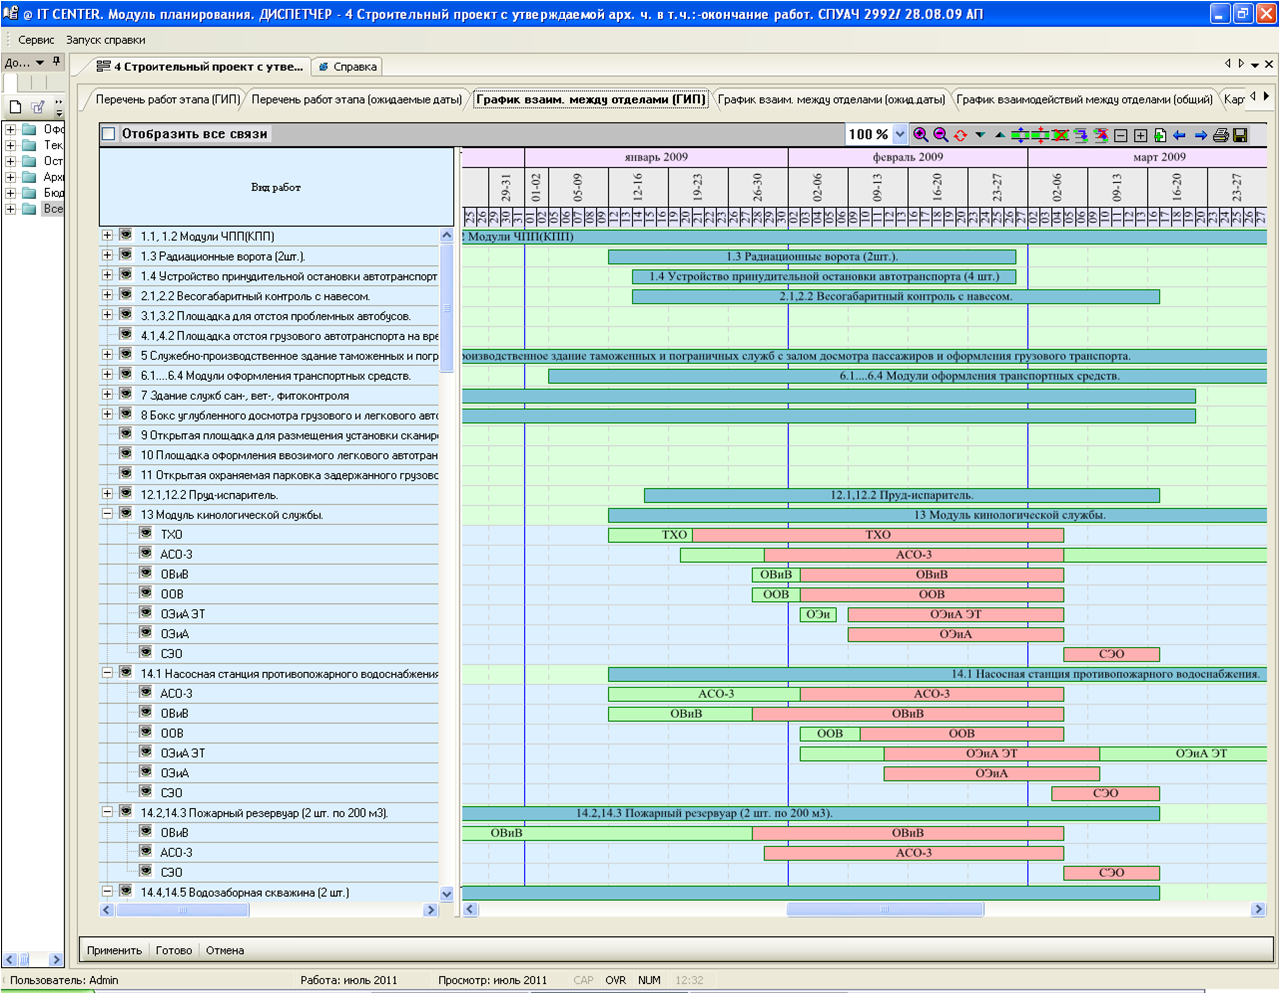
For each work, three layers can be displayed in the graphics:
Planned layer (reflects the timing of the schedule at the stage of signing the contract)
Working layer layer (reflects working deadlines)
Actual layer layer (reflects the actual completion time - when the work is completed)

When comparing layers, you can see how much the working deadlines have changed compared to the planned ones, how the actual deadlines differ from the working ones, which department is delaying the transfer of the task. This will allow timely identification and elimination of the reason for the failure to complete work under the contract. The schedule can be adjusted during work in a Gantt chart or in a table (at the user’s choice). The schedule can indicate connections between activities. When the deadline for completing work on which other work depends increases,
the program will suggest: reducing the deadline for completing subsequent work (if it is impossible to prevent the deadline for completing the work under the contract) or moving the work forward (without changing its duration).
The system will automatically generate a schedule for performing work under contracts for each department:

The system provides the ability to print the graph in a table and in the form of a Gantt chart. The program can generate reports on overdue work, on work that is planned for release for a specified period, and others.
The information presented reflects only part of the module's capabilities. The module can be used both in conjunction with the economic accounting module and independently. For more detailed comments, please contact. You will be advised on all questions of interest, it is possible to organize a presentation.