A detailed guide to debugging JavaScript code in Chrome Devtools.
The ability to debug code is an important skill for a developer. It is important to understand and use the wide range of debugging tools that exist for a particular programming language.
Unfortunately, debugging may not seem as obvious when working with JavaScript outside of a full IDE. At least — at first glance.
This article will look at how you can debug JavaScript code in Google Chrome Dev Tools and in the Visual Studio Code editor.
Translator's note: by clicking on this link, you can see the video version of this article Debugging JavaScript in Google Chrome and Visual Studio Code in English.
Presets
This article will look at the debugging process using a test application called “Quick Chat” as an example:

You have two ways to use this application. You can create it yourself using this a series of video lessons. Or you can use the source code already ready-made application"Quick Chat":

Whichever option you choose, you'll need to run the Quick Chat app locally.
You can run the application from Node.js ( how do I do it). Or use the plugin under Visual Studio Code called Live Server.
If you are new to working with this plugin, you can learn how to work with it using this video — Live Server Extension in Visual Studio Code.
Translator's note: video in English.
Technically, I'm getting the username incorrectly by using usernameInput.text instead of the correct usernameInput.value option. If I made such a mistake in real life, my first thought would be to use the console.log() tool.
But this is not exactly the case that could help me, as you can see in the image below. If using console.log() was also your first thought, you have come to the right place and are doing the right thing by reading this article!

Debugging Basics
Let's start with the basics. The idea behind debugging is that inside program code you can set so-called breakpoints ( breakpoints) to stop program execution at a specific location.
This gives you, as a developer, the opportunity to look at the current state of the application and check, for example, the values of variables in it. You can even go further and track any variables of your choice so that whenever the application stops, you can check the values of those variables.
After setting a breakpoint ( breakpoint) in the code, as a rule, there are several options for further actions:
- continue program execution
- go step by step through all stages of the program - line by line
- exit the current function you are in
- go to next function
You will also have access to view the call stack ( call stack). In other words, since functions in a program can call other functions for execution, you can view call history these functions.
Debugging in Google Chrome
To start debugging your application in the Google Chrome browser, add a clickBtn button event handler operator debugger as below:
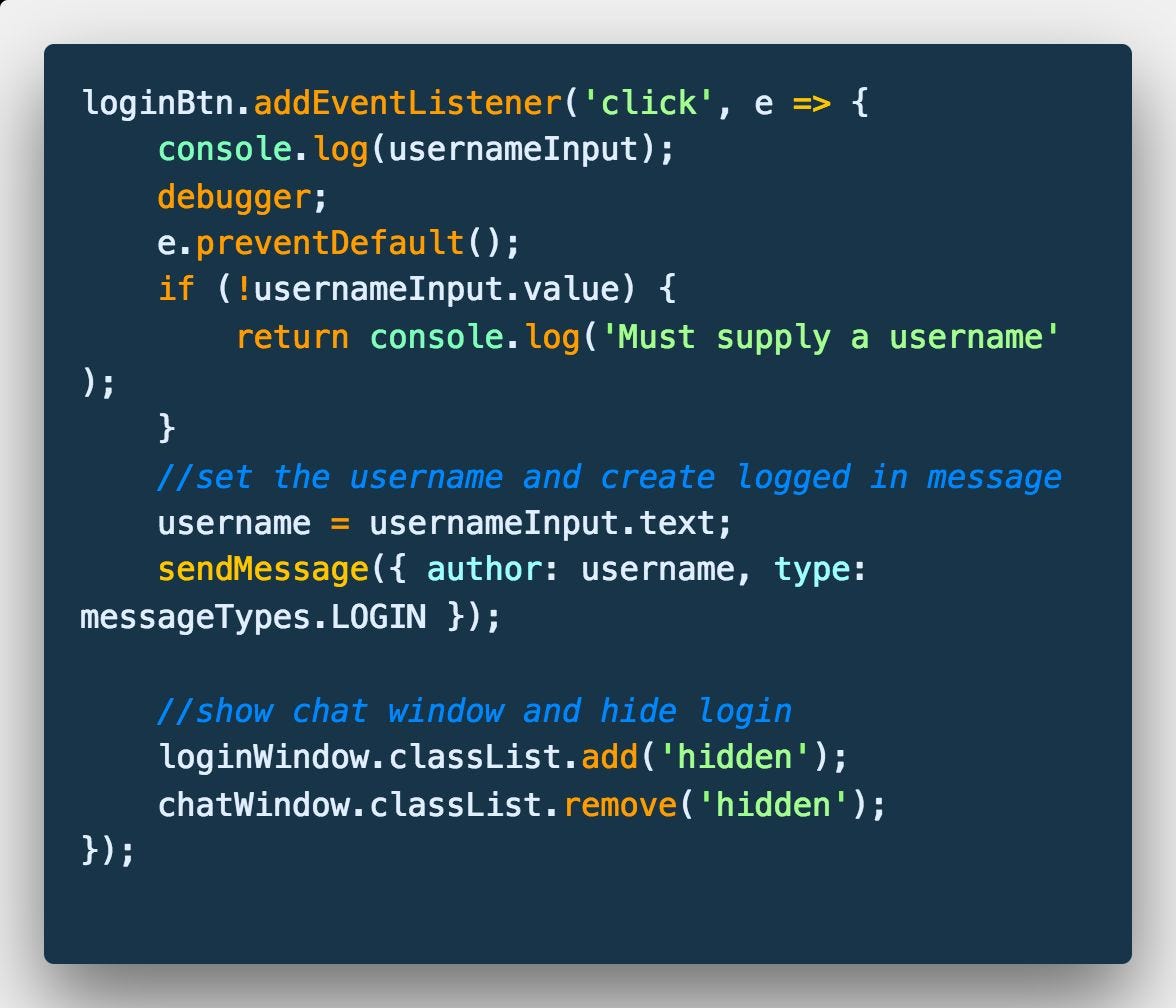
When program execution reaches the line with the debugger statement, the application will be suspended and the browser's debugging tools will be automatically activated Google Chrome.
Please note that the application in the browser window is shaded gray to show that it is paused. Also note that the Sources tab in Chrome Dev Tools opened automatically:

Let's see what we see on the Sources tab.
Sources Tab
The first thing you might notice on this tab is a copy of the application's source code. This is the code that the browser has loaded and works with.
You may also notice that the line of code with the debugger statement is highlighted in blue to tell us that the application has stopped executing at this point in the code:

The Google Chrome browser provides us with the ability to view the source code of an application. Having the source code in front of you, you can install in it breakpoints.
A breakpoint is intended to indicate a place where program execution should be stopped. Operator debugger, which we used in the example above, functions like breakpoint, but in source code applications like this breakpoint there doesn't have to be only one.
Breakpoint is a deliberate stop or pause of program execution.
To add breakpoint, you need to click on gutter - the field to the left of the numbering of lines of code. Once you complete this action, you will notice that the Google Chrome browser has automatically added this breakpoint to the “Breakpoints” list:

Scope tab
The Scope tab is where you can monitor variables in your application. Please note that this tab has three sections: local scope ( Local), global scope ( Global) and script section ( Script).
In the scripts section, you can track variables in the scope of the current script:

Most of You will spend most of the application debugging process in this tab. This is a much more efficient alternative to using multiple console.log() s.
Watch tab
As mentioned earlier, in addition to viewing variables in the Scope tab, you can also define variables whose values you would like to monitor throughout the program's execution.
By adding a variable in the Watch tab, each time you set a breakpoint, you can quickly check the value of that variable (which may be undefined depending on where you are in the code).
Click the plus sign and enter the name of the variable you want to monitor, in our case usernameInput:

Stepping, call stack, and breakpoint list
The "Sources" tab section, located in the lower left corner of the debugger window, allows you to view a list of breakpoints, the call stack ( call stack), etc.

IN call stack There is only one function which is the event handler for the login button. The function is listed because it is the only function that was called on at the moment. Since some functions can call other functions for execution, this chain will be updated accordingly.
Also notice the arrow buttons at the top of the screen. These correspond to the functions above for continuing execution of your code or walking through it line by line ( stepping). I would recommend testing these buttons a little to get used to how the code can be executed.
Finally, there are various types breakpoints that can be set. Let's look at an example of creating a conditional breakpoint ( conditional breakpoint), which will only fire when a certain condition is met.
For example, let's say we want to prevent the login button event from being processed only when the user tries to login without entering a username.
We can do this by clicking right click mouse on the gutter field and creating breakpoint with the following condition — usernameInput.text === "" :

In case of debugging Quick apps Chat, if you click the login button without a username, this will be launched breakpoint. Otherwise, the code will continue to execute as usual.
Please note that there are even more available options breakpoints, which are not discussed in this article.
Debugging in Visual Studio Code
Chrome Developer Tools is one of the best of its kind. As you have already seen, it offers excellent features and functionality for debugging the application.
However, the Visual Studio Code development team has done great job in order to make the debugging process in this editor even more perfect.
I really like Visual Studio Code and spend more time in it than any other code editor. This process also includes debugging.
To start debugging code in VS Code, you will need to install the Debugger for Chrome plugin:

Let's take a look at the Debug tab. By default, it is located in the editor's sidebar. Open this tab by clicking on the icon that looks like a bug ( bug).
Once you open this panel, you will see tools very similar to those we saw in Google browser Chrome — variables, call stack, breakpoints:
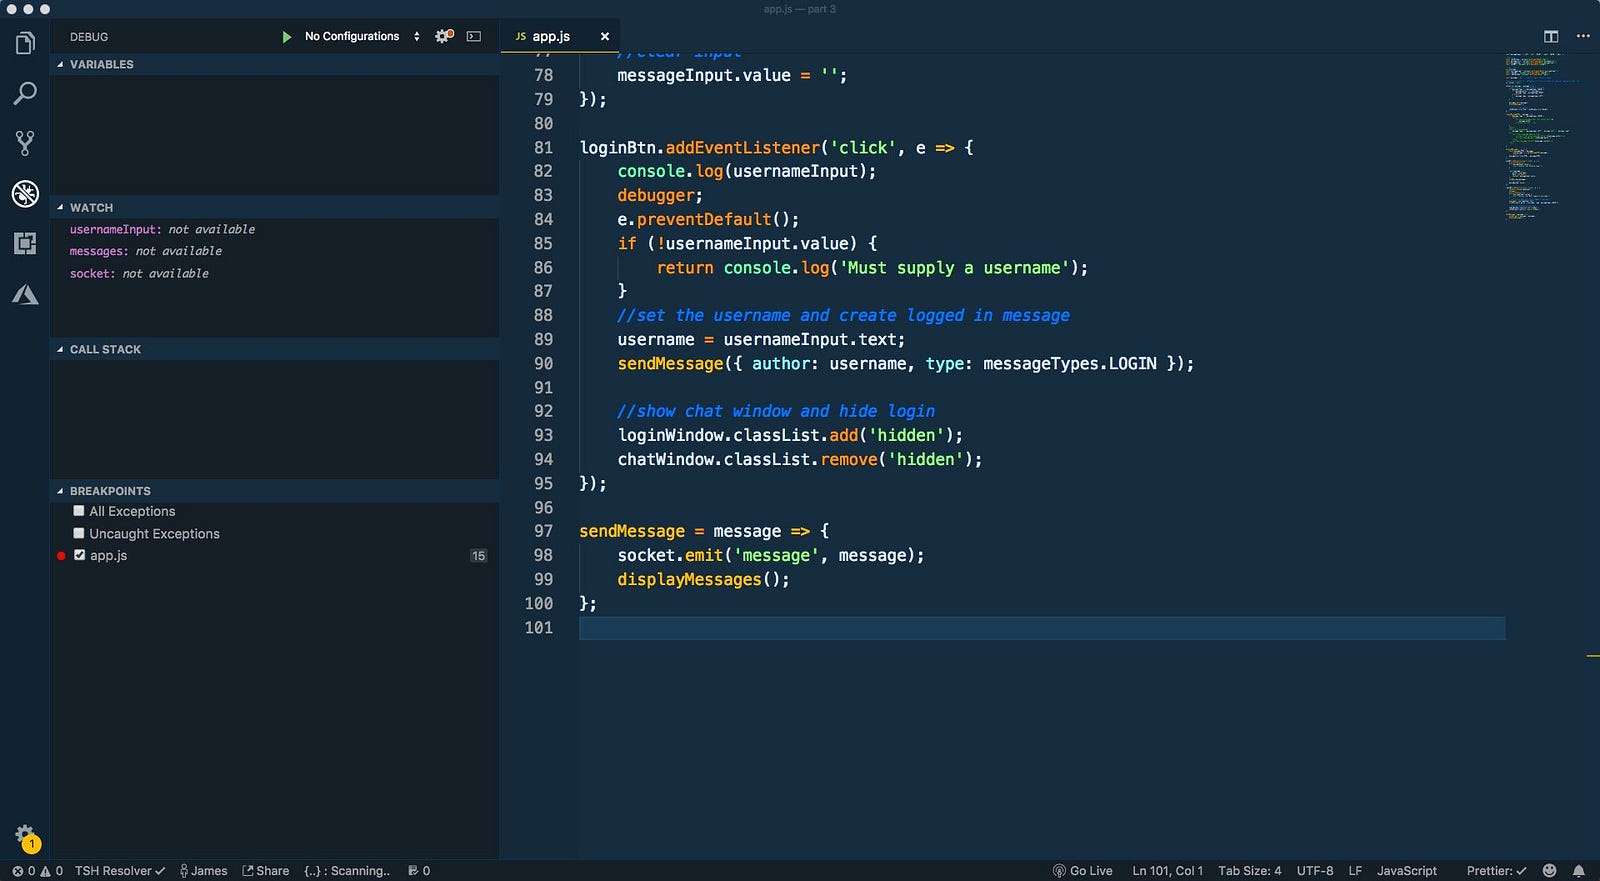
Majority functionality, which we dealt with in Chrome Dev Tools, are also available in VS Code.
Now that we're familiar with the Debug tab, we need to create a configuration that will tell the VS Code editor how to debug our application.
VS Code stores the debug configuration in a launch.json file inside the .vscode folder. To have VS Code create this file for us, in the editor menu, open the “No Configurations” drop-down list and select “Add Configuration”.
VS Code stores the debug configuration in a file called launch.json inside the .vscode folder

Then from this list select "Chrome".
Imagine you're working on this incredible new web application and your testers have asked you to fix the following bugs:
- The “Loading...” status bar message does not disappear when the application has finished loading.
- The default language is Norwegian, even in English versions IE and Firefox.
- Somewhere in the code a global variable prop was created.
- For some reason, all elements in the DOM viewer have the “clone” attribute.
Running debuggers
- In Firefox, you must make sure that you have installed Firebug extension. Select “Tools > Firebug > Open Firebug”.
- In Opera 9.5+, select “Tools > Advanced > Development Tools.”
- In IE beta, go to “Tools > Panels > Explorer Bars > IE Developer Toolbar.”
- In Safari or WebKit, first enable the debug menu (1), then select “Develop > Show Web Inspector”
Error #1: “Loading...” message
If you look at the application you are debugging, you will first see what is shown in Figure 1.rice. 1: Initial view of our JavaScript application in Dragonfly and Firebug, respectively.
When you look at the source code in the debugger, notice the clearLoadingMessage() function at the very beginning of the code. This is a good place for a checkpoint.
How to install it:
- Click in the left margin on the line number to set a breakpoint on the first line
- Reload the page.
When the page is reloaded, the script will stop running and you will see what is shown in Figure two.
rice. 2: debuggers stopped at control point inside clearLoadingMessage.
Let's take a look at the function code. As you can easily see, it updates two DOM elements, and line 31 mentions the word statusbar. It looks like getElements("p", ("class":"statusbar")).innerHTML looks for the statusbar element in the DOM tree. How can we quickly test our assumption?
Paste this statement into the command line to test. Figure three shows three screenshots (Dragonfly, Firebug and IE8) after reading innerHTML or outer HTML element, returned by the command you are researching.
To check, do the following:
- Find the command line:
* In Firebug, switch to the “Console” tab.
* In Dragonfly, look below the JavaScript code panel.
* In IE8, find the "Console" tab on the right. - Paste getElements("p", ("class":"statusbar")).innerHTML into the command line.
- Press Enter.
rice. 3: Output the command result in Dragonfly, Firebug, and IE8, respectively.
The command line is very useful tool, which allows you to quickly test small pieces of code. The Firebug console integration is very useful - if your command outputs an object, you get a very intelligent view. For example, if it is a DOM object - you will see the marked up result.
You can use the console to do more in-depth research. JavaScript string, which we are studying, does the following three things:
- Gets a reference to the statusbar element.
- Finds firstChild, in other words, the first node in this paragraph.
- Sets the innerText property.
getElements( "p" , ("class" :"statusbar" )).firstChild.innerText
Surprise, at the end... nothing. Thus, the expression getElements("p",("class:"statusbar"")).firstChild points to some object in the DOM that does not contain any text, or does not have an innerText property.
Then, the next question is: what actually comes first? child element at the paragraph? Let's ask this question at the command line. (See fourth picture).
rice. 4: command line StDragonfly debugger, output [Text object].
The Dragonfly's debugger output - [Text object] shows that this is a DOM text node. Thus we found the cause of the first problem. A text node does not have an innerText property, so setting p.firstChild.innerText to a value does nothing. This error can easily be fixed by replacing innerText with nodeValue, which is a property defined by the W3C standard for text nodes.
Now that we've dealt with the first error:
- Click or Run button to finish the script.
- Don't forget to reset the set checkpoint by clicking on the line number again.
Mistake two: language definition problem.
You may have noticed the lang;/*language*/ variable at the beginning of the script. One might suspect that the code setting the value of this variable is causing the problem. You can try to find this code using the search function built into debuggers. In Dragonfly the search is located right above the code viewer, in Firebug it is on the right top corner(see Figure 5)To find where the localization problem is likely occurring, do the following:
- Type lang = in the search field.
- Set a breakpoint on the line where lang variable the value is set.
- Reload the page.
rice. 5: Search in Dragonfly and WebInspector.
To check what this function does:
- Click the "step into" button to enter the getLanguage function.
- Press it again and again, executing the code step by step
- In the variable viewing window, watch how their values change.
var str1 = navigator.userAgent.match(/\((.*)\)/);
var ar1 = str1.split(/\s*;\s*/), lang;
for (var i = 0; i< ar1.length; i++){
if (ar1[i].match(/^(.(2))$/))(
lang = ar1[i];
}
}
As you step through the code, you can use the Local Variables Viewer. Figure 6 shows how it looks in Firebug and IE8 DT; we expanded the ar1 array to see its elements.
rice. 6: Pane for viewing local variables of the getLanguage function in Firebug IE8’s
The expression ar1[i].match(/^(.(2))$/) simply searches for a string consisting of two characters, such as “no”, “en”. However, as you can see in the screenshot in Firefox, information about the language is presented in the form “nn-NO” (2). IE does not put language information into the user agent at all.
Thus, we found the second error: the language was determined by searching for a two-letter code in the user agent line, but Firefox has a five-character language designation, and IE does not have it at all. Such code must be rewritten and replaced with language detection either on the server side using the Accept-Language HTTP header, or by retrieving it from navigator.language (navigator.userLanguage for IE). Here is an example of what such a function could be
function getLanguage() (
var lang;if (navigator.language) (
lang = navigator.language;
) else if (navigator.userLanguage) (
lang = navigator.userLanguage;
}if (lang && lang.length > 2) (
lang = lang.substring(0, 2);
}return lang;
}
Mistake Three: The Mysterious “prop” Variable
rice. 7: In the Firebug and Dragonfly variable view panel, the global prop variable is visible
In Figure 7 you can clearly see the “prop” variable. In well-written applications, the number of global variables should be kept to a minimum, since they can cause problems when, for example, two parts of the application want to use the same variable. Let's assume that tomorrow another team will add new features to our application and also declare the "prop" variable. We'll end up with two different pieces of application code using the same name for different things. This situation often leads to conflicts and mistakes. You can try to find this variable and declare it local. To do this, you can use the search, as we did in the previous case, but there is a smarter way...
Debuggers for many other programming languages have the concept of a “watch,” which enters debugging mode when a specified variable changes. Neither Firebug nor Dragonfly support "observers" currently, but we can easily emulate similar behavior by adding next line to the beginning of the code under study:
__defineSetter__( "prop" , function () ( debugger; ));
Do the following:
- Add debugging code to the beginning of the very first script.
- Reload the page.
- Notice how the script execution is interrupted.
When you reload the page, code execution will immediately stop where the "prop" variable is defined. The actual stop will occur at the point where you added the above line. One click on the “step out” button will take you to the location where the variable is set.
for (prop in attributes) (
if (el.getAttribute(prop) != attributes) includeThisElement = false ;
It's not hard to notice for loop in which the prop variable is declared without keyword var, i.e. global. It's not difficult to fix this, just add var and fix the error.
Mistake four: a “clone” attribute that shouldn’t be there
The fourth bug was apparently discovered by an advanced tester using the DOM inspector, since its existence does not appear in any way in user interface applications. If we open the DOM inspector (in Firebug this is the “HTML” tab, in Dragonfly it is called “DOM”), we will see that many elements have a clone attribute, which should not be there.rice. 8: Dragonfly’s DOM inspector shows problematic code.
Since this does not affect the application's users in any way, this bug may not be considered serious, but do not forget that it can significantly affect performance, since the script sets the attribute on hundreds and thousands of elements.
Most quick way The solution to this problem is to set a breakpoint that fires when an attribute called clone is set on some HTML element. Can debuggers do this?
JavaScript is a very flexible language, and one of its strengths(or weak ones, depending on your point of view) is what you can replace basic functions language with your own. Add this piece of code to the page, it will override system method setAttribute, causing the code to stop when the "clone" property is set:
var funcSetAttr = Element.prototype.setAttribute; /* save a link to the system method */
Element.prototype.setAttribute = function (name, value) (
if (name == "clone" ) (
debugger; /* stop the script */
}
funcSetAttr.call(this ,name,value); /* call a previously saved system method so that normal properties are set correctly */
};
So, we do the following:
- Add the following code to the beginning of the first script on the page.
- Reload the page.
When execution stops at a breakpoint, you'll want to know where the setAttribute() call occurred, meaning you'll need to go back up in the function call chain and see what's happening there. You can use a call stack for this.

rice. 9: Call stack in Dragonfly and IE8.
Figure 10 shows the stack in Firebug. In the line " setAttribute
![]()
rice. 10: Call stack in Firebug. The most recently called function on the left.
By clicking on the names of functions on the stack, you can determine how you got to this point. It's important to try it yourself to understand how it works. Note that as you navigate through the stack, the contents of the Local Variables pane also updates to show their state at the time your selected function was executed.
How to use the call stack to find the problematic function:
- Click on the name of the function in the stack that you want to see.
- Please note that local variables are updated to the values they have in the selected context.
- Remember that if you use the step buttons they will move you from the breakpoint location even if you are in a different part of the stack.
for (var prop in attributes) (
el.setAttribute(prop, attributes);
}
where you will see setAttribute call. The Local Variables panel shows that the value of the variable "prop" is indeed "clone". The prop variable is defined in a for...in loop. This tells us that this is the name of one of the properties of the “attributes” object. This object is passed to the function as the second parameter. If you move up the stack one more level, you will see the following code:
var form = makeElement('form', ( action:’/login’, method:’post’, name:’loginform’ ), document .body);
The second parameter of the method is highlighted in bold - this object does not have a clone property. So where did it come from?
Let's go back to the makeElement function again and take a closer look at the attribute variable and its "clone" property. You can click on the function value of this property to go to the place where it is assigned, it will be highlighted in blue
rice. 11: Firebug shows us where the clone property was defined.
So we found the cause of the fourth error: the clone method is added to all objects using Object.prototype. This approach is considered bad practice, because in for...in loops on objects, all the properties you set through Object.prototype will be visible. This can lead to very subtle errors.
To fix this error, you can move the clone method from the object's prototype directly to the object itself, and then replace all calls to obj.clone() with Object.clone(obj), as shown in the example:
// BAD, you shouldn't do this
Object.prototype.clone = function() (
var obj = ();
for (var prop in this ) (
obj = this ;
}
return obj;
}
// Code. demonstrating the use of the clone() method:
var myObj1 = ( "id" : "1" );
var myObj2 = myObj1.clone();
Do it better like this:
Hello! Continuing the topic, let's talk about debugging scripts using the browser. For example, let's take the best browser on Earth - Chrome.
In principle, such tools are available in any browser, and if you consider that most browsers run on the same engine as Chrome, then in principle there will not be much difference. Firefox is also very good with its Firebug tool.

General view of the Sources panel
Launch the Chrome browser.
Press F12 and the Developer Tools will launch.
Go to the Source tab

There are 3 zones here:
- Source files area. It contains all the project files
- Text area. This area contains the text of the file
- Area of information and control. We'll talk about her later
As a rule, when debugging, the source files area is not needed, so you can hide it with the button.
General control buttons

3 most commonly used control buttons:
Format This button allows you to format the code. You may need it if you want to format someone else's code. Console A very important button that opens the console when pressed. You can enter various commands and operators in JavaScript in the console. Window In the case of a large section of code, it allows you to open the code in a separate window.Breakpoints
Let's look at the pow.js file as an example. If you click on any line of this file, a breakpoint will be set on that line.
It should look something like this:

A breakpoint is also called a breakpoint; this is more of a jargon that has been assimilated into our language and literally also means a breakpoint.
In the code where you made a breakpoint, you can look at the values of variables at each step, in general, track it in every possible way.
Breakpoint information appears on the Breakpoints tab.
The Breakpoints tab is very useful when the code is very large, it allows you to:
- Quickly go to the place in the code where the breakpoint is set by simply clicking on the text.
- Temporarily disable a breakpoint by clicking on the checkbox.
- Quickly remove a breakpoint by right-clicking on the text and selecting Remove.
Some additional features
- A breakpoint can also be triggered directly from a script using the debugger command: function pow(x, n) ( ... debugger; //<-- отладчик остановится тут... }
- Right-clicking on a line number in pow.js will allow you to create a so-called conditional breakpoint, i.e. set a condition under which the breakpoint will be triggered.
Stop and look around
Since our function runs simultaneously with the page loading, the easiest way to activate the JavaScript debugger is to reload it. To do this, press F5. And at the same time, the execution of the script will be stopped on the 6th line.

Pay attention to the information tabs:
- Watch Expressions– here you can see the current value of the variables that you are monitoring in the script.
- Call Stack– shows the call stack - these are all the calls that led to this line of code.
- Scope Variables– shows variables. Moreover, it shows both global and local variables.
Execution Management
Now let's run the script and track its operation. Pay attention to the panel at the top there are 6 buttons, the operation of which we will consider.
– continue execution, or you can press the F8 key. This button continues execution of the script. This way we can step through our script as if it were running in a browser. – take a step without going into functions, or F10 key.Execute one step of the script without going inside the function.
– take a step inside the function, key F11. Executes one step of the script and at the same time goes inside the function. – execute until exiting the current function, key Shift+F11.executes the entire code contained in the function.
– disable/enable all breakpoints. This button simply disables and, when pressed again, enables all breakpoints. – enable/disable automatic stop when an error occurs. This button is very useful when debugging and allows you to enable or disable automatic stopping when an error occurs.The debugging process itself consists of going through the program step by step and observing the values of the variables.
Browser Console
When debugging script code, it can be useful to go to the Console tab and see if there are any errors there. You can also output information to the console using console.log().
For example:
// the result will be visible in the console for (var i = 0; i< 6; i++) { console.log("значение", i); }
The console is available in any browser
Console errors
JavaScript script errors can be viewed in the console.

In the console you can see:
The red line is the actual error message.
Total
The debugger allows you to:
- Stop at the marked point (breakpoint) or at the debugger command.
- Execute code - debug the program one line at a time or to a certain point.
- Monitor variables, execute commands in the console, etc.
In the developer tools there are other tabs like Elements allows you to view the HTML code of the page, Timeline shows how many files the browser downloads and how much time it takes. But these tabs are not very interesting to us yet.
Forget about debugging with console.log forever! Learn how to use breakpoints to debug code in Chrome Developer Tools
Translation of the articleBrandon Morelli : Learn How To Debug JavaScript with Chrome DevTools . Published with permission of the author.

Finding and fixing errors can be difficult. You may be tempted to use console.log() uncontrollably to get your code to work correctly. It's over!
This article is about the correct way to debug! You'll learn how to use Chrome Developer Tools to set breakpoints and examine code. This approach is often the most effective way to find and fix errors in your code.
This tutorial shows how to debug one specific issue, but a similar workflow is useful for debugging all types of JavaScript errors.
Step 1: Reproducing the error
Reproducing an error—the first step to debugging—means discovering the series of actions that lead to its appearance. You may have to reproduce the bug many times, so it is advisable to eliminate any unnecessary steps.
To reproduce the error that we are going to fix throughout this tutorial, follow the instructions below:
- Here is the web page we will be working with for this article. Open it in a new tab: DEMO.
- In demo for Number 1 enter 5.
- Enter 1 for Number 2.
- Click Add Number 1 and Number 2.
- Look at the label below the inputs and button. She says that 5 + 1 = 51.
Oops. This is an incorrect result. The result should be 6. This is the error we are going to fix.
Step 2: Pausing code execution using a breakpoint
DevTools allows you to pause your code mid-execution and retrieve the values everyone variables at this point in time. The tool for pausing code is called a breakpoint. Try it now:
- Return to the demo and open DevTools by pressing Command+Option+I (Mac) or Control+Shift+I (Windows, Linux).
- Go to the tab Sources.
- Click Event Listener Breakpoints to expand the menu. DevTools reveals a list of event categories such as Animation And Clipboard.
- Expand event category Mouse.
- Select click.
- Returning to the demo, click again Add Number 1 and Number 2. DevTools will pause and highlight the line of code in the panel Sources:
When you hit click you set a breakpoint based on all click events. When the click occurs any node and this node has a click event handler, DevTools automatically stops execution on the first line of click handler code for this node.
Step 3: Explore the Code
One common cause of errors is that the script is executed in the wrong order. By examining the code, you can execute the code one line at a time and find out exactly where it is executed in an unexpected order. Try it now:
- On the panel Sources in DevTools click Step into next function call.
This button allows you to execute the onClick() function one line at a time. DevTools will stop execution and highlight the following line of code:
If (inputsAreEmpty()) (
- Now click the button Step over next function call.
This tells DevTools to execute the inputAreEmpty() function without going into it. Please note that DevTools skips several lines of code. This occurs because inputAreEmpty() evaluates to false , so the if statement block of code is not executed.
This is the basic idea behind code exploration. If you look at the get-started.js code, you'll see that the error is probably somewhere in the updateLabel() function. Instead of examining every line of code, you can use a different type of breakpoint to pause the code closer to where the error occurs.
Step 4: Set another breakpoint
The most common breakpoints set on lines of code are when you have a specific line of code that you want to pause. Try it now:
- Look at the last line of code in updateLabel() :
To the left of the code you can see the number of that particular line: 32 . Click on it. DevTools will place a blue icon over the number. This means there is a breakpoint on this line. DevTools will now always pause before it.
- Click the button Resume script execution:
The script will run until it hits a breakpoint.
- Look at the lines of code already executed in updateLabel() . DevTools outputs the values of addend1, addend2 and sum.
The sum value looks suspicious. It looks like it is being treated as a string when it should be a number. This may be the reason for our error.
Step 5: Checking the Variable Values
Another common cause of errors is when a variable or function generates values other than expected. To see how values change over time, many developers use console.log() , but console.log() can be tedious and ineffective for two reasons. First, you may need to manually edit code with a lot of console.log() calls. Second, you may not know exactly which variable is associated with the error, so you may need to log many variables.
Watch Expressions is a DevTools alternative to console.log() . Use Watch Expressions to track the value of variables over time. As the name suggests, Watch Expressions is not limited to just variables. You can store any valid JavaScript expression in Watch Expression. Try it now:
- On the panel Sources DevTools click Watch. The section will open.
- Click Add Expression.
- Enter typeof sum .
- Press Enter. DevTools will show: typeof sum: "string" . The value to the right of the colon is the result of your Watch Expression.
As expected, sum is treated as a string when it should be a number. This is the reason for our error in the demo.
We tell you how to use the Chrome Devtools panel, which is convenient for debugging.
Finding and fixing errors can be difficult for beginners. If you think that using console.log() to debug your code is the best solution, then you are wrong.
In this article, we will introduce some excellent Google Chrome Devtools for debugging. This process is a much more efficient way to solve this problem.
This is just one simple example of how to use debugging, but it can be applied to any problem.
Step 1: Reproduce the bug
Reproducing bugs is always the first step towards debugging. This means finding the sequence of actions that lead to the error. The process can be long, so try to optimize it.
To follow the steps in this tutorial yourself, do the following:
- Here is the web page we will be working with in this tutorial. Don't forget to open it in a new tab;
- Enter the number 5 in the “Number 1” field;
- Enter the number 1 in the “Number 2” field;
- Click on the “Add” button;
- Look, they tell you that 5+1=51;
Oops, that's obviously wrong. The result should be the number 6, and this error needs to be corrected.
Step 2: Pause execution using a breakpoint
DevTools allow you to stop code execution in progress and view the values of all variables at that point in time. The tool for pausing code is called a breakpoint. Try:
- Return to our test page and enable DevTools by pressing Cmd + Option + I (Mac) or Ctrl + Shift + I (Windows, Linux);
- Go to the "Sources" tab;
- Expand "Event Listener". DevTools will expand a list of event categories such as animation and clipboard;
- Check the “click” box;
- Returning to the page, add “Number 1” and “Number 2” again. DevTools will pause the demo and highlight the line of code in the Sources panel. DevTools will highlight this line of code:
function onClick() (
function onClick() (
Why is this happening?When you select "click", you set breakpoints that depend on click events on each element that has a handler for it.
Step 3: Perform step-by-step debugging
One common reason why errors occur is that the script is not executed in the order you think it should. You can avoid this problem by observing the execution of the code line by line. Let's try:
- In the "Sources" panel, click "Step into next function call button"
This button will allow you to sequentially track the execution of the onClick function. Stop the process when DevTools highlights the following line of code:
if (inputsAreEmpty()) (
if (inputsAreEmpty()) (
- Now click the “Step over next function call button”;
DevTools now knows to execute inputAreEmpty() without debugging its contents. Please note that DevTools skips several lines of code. This is because inputAreEmpty() returns false, so the if block was not executed.
This is the essence of step-by-step code debugging. If you look at the code in get-started.js, you'll see that the error is probably somewhere in the updateLabel() function. Instead of going through each line of code, you can use a different type of breakpoint to stop the process closer to where the error occurs.
Step 4: Select a different breakpoint
The line-of-code type is the most popular breakpoint. If you know where the error might be, use this type:
- Look at the last line of code in updateLabel(), which looks like this:
label.textContent = addend1 + " + " + addend2 + " = " + sum;
label. textContent = addend1 + " + " + addend2 + " = " + sum ;
- To the left of this code you will see a line number: 32. Click 32. Now DevTools will always pause until this line of code is executed;
- Click the "Resume script execution button". The script will continue to execute until the next line of code with a breakpoint;
- Look at the lines of code in updateLabel() that have already been executed. DevTools outputs the values of addend1, addend2 and sum.
- In the "Sources" panel, select the "Watch" tab;
- Then click "Add Expression";
- Type typeof sum;
- Press enter. DevTools will show typeof sum: "string". This value is the result of Watch Expression.
- In the code editor, in the Sources panel, replace var sum = addend1 + addend2 with var sum = parseInt(addend1) + parseInt(addend2); This is line #31.
- Press Cmd + S (Mac) or Ctrl + S (Windows, Linux) to apply the changes. The background of the code will change to red to indicate that the script has been modified in DevTools;
- Click "Deactivate breakpoints"
- Click "Resume script execution".
The amount looks suspicious. It looks like it's not being evaluated as a number, but as a string. This is another common cause of errors.
Step 5: Check Variable Values
A common cause of errors is that a variable or function generates the wrong value. Many developers use console.log() to see how values change, but console.log() is a poor choice for at least two reasons: First, it may require manual editing of code with many calls to console.log() ), secondly, you may not know which variable is associated with the error, so you will have to display several variables at once.
One alternative to console.log in DevTools is Watch Expressions. Use Watch Expressions to track changes in variable values. As the name suggests, Watch Expressions is not limited to just variables. You can store any valid JavaScript expression in Watch Expression:

As expected, sum is treated as a string, not a number. This is the same error that we talked about above.
Another DevTools alternative to console.log() is the console. Developers often use it to overwrite variable values when debugging. In your case, the console may be handy to check ways to fix the error. Example:

Step 6: Make Corrections
You have identified where the error is. All that remains is to fix it by editing the code and restarting the demo. You can edit JavaScript code directly in the DevTools UI:
The color will change to blue. In this mode, DevTools ignores any breakpoints you have set.
Enter numbers in the fields and test. Now everything should work as it should!