A detailed guide to debugging JavaScript code in Chrome Devtools.
Hello! Continuing the topic, let's talk about debugging scripts using the browser. For example, let's take the most best browser on Earth - Chrome.
In principle, such tools are available in any browser, and if you consider that most browsers run on the same engine as Chrome, then in principle there will not be any special differences. Firefox is also very good with its Firebug tool.

Launch the Chrome browser.
Press F12 and the Developer Tools will launch.
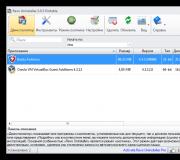
Go to the Source tab

There are 3 zones here:
As a rule, when debugging, the source files area is not needed, so you can hide it with the button.
General control buttons
3 most commonly used control buttons:
Format This button allows you to format the code. You may need it if you want to format someone else's code. Console Very important button clicking on which opens the console. You can enter various commands and operators in JavaScript in the console. Window In the case of a large section of code, it allows you to open the code in a separate window. BreakpointsLet's look at the pow.js file as an example. If you click on any line of this file, a breakpoint will be set on that line.
It should look something like this:

A breakpoint is also called a breakpoint; this is more of a jargon that has been assimilated into our language and literally also means a breakpoint.
In the code where you made a breakpoint, you can look at the values of variables at each step, in general, track it in every possible way.
Breakpoint information appears on the Breakpoints tab.
The Breakpoints tab is very useful when the code is very large, it allows you to:
- Quickly go to the place in the code where the breakpoint is set with a simple click to text.
- Temporarily disable a breakpoint by clicking on the checkbox.
- Quickly remove a breakpoint by right-clicking on the text and selecting Remove.
Some additional features
- A breakpoint can also be triggered directly from a script using the debugger command: function pow(x, n) ( ... debugger; //