Network traffic analyzers: review of paid and free solutions. Network packet analyzers
When regular user hears the term “sniffer”, he immediately becomes interested in what it is and why it is needed.
We will try to explain everything in simple language.
However, this article will be intended not only for novice users, but also for.
Definition
Sniffer is a traffic analyzer. In turn, traffic is all information that passes through computer networks.
This analyzer looks at what information is being transmitted. To do this, it must be intercepted. In fact, this is an illegal thing, because in this way people often gain access to other people's data.
This can be compared to a train robbery - a classic plot of most Westerns.
You are transferring some information to another user. It is carried by a “train”, that is, a network channel.
The idiots from Bloody Joe's gang intercept the train and rob it completely. In our case, the information goes further, that is, attackers do not steal it in the literal sense of the word.
But let's say that this information is passwords, personal notes, photographs and the like.
Attackers can simply rewrite and photograph all this. This way they will have access to sensitive data that you would like to hide.
Yes, you will have all this information, it will come to you.
But you will know that everyone knows the same thing and is completely strangers. But in the 21st century, information is most valued!
In our case, exactly this principle is used. Certain people stop traffic, read data from it and send it on.
True, in the case of sniffers, everything is not always so scary. They are used not only to gain unauthorized access to data, but also to analyze the traffic itself. This important part works of system administrators and simply administrators of various resources. It’s worth talking about the application in more detail. But before that, we will touch on how these same sniffers work.
Operating principle
In practice, sniffers can be portable devices, which are literally placed on the cable and read data from it, as well as programs.
In some cases, it is simply a set of instructions, that is, codes that must be entered in a certain sequence and in a certain programming environment.
In more detail, traffic interception by such devices can be read by one of following methods:
1 By installing hubs instead of switches. In principle, listening to a network interface can be done in other ways, but all of them are ineffective.
2 By connecting a literal sniffer to the place where the channel breaks. This is exactly what was discussed above - and is put small device, which reads everything that moves along the channel.
3 Installation of a traffic branch. This fork is routed to some other device, possibly decrypted and sent to the user.
4 An attack whose goal is to completely redirect traffic to the sniffer. Of course, after the information reaches the reading device, it is again sent to the end user for whom it was originally intended. in its purest form!
5 By analysis electromagnetic radiation , which arise due to traffic movement. This is the most complex and rarely used method.
Here is an approximate diagram of how the second method works.
True, it is shown here that the reader is simply connected to the cable.
In fact, doing it this way is almost impossible.
The fact is that the end user will still notice that there is a break in the channel at some point.

The very principle of operation of a regular sniffer is based on the fact that within one segment they are sent to all connected machines. Quite a stupid, but so far no alternative method! And between segments, data is transferred using switches. This is where the possibility of intercepting information using one of the above methods appears.
Actually, this is what is called cyber attacks and hacking!
By the way, if you install these same switches correctly, you can completely protect the segment from all kinds of cyber attacks.
There are other methods of protection, which we will talk about at the very end.
Application
Of course, first of all, this concept has the application discussed above, that is, hacker attacks and illegal receipt user data.
But besides this, sniffers are also used in other areas, specifically in the work of system administrators.
In particular, such devices or programs help to perform the following tasks:

As you can see, the devices or programs we are considering can greatly facilitate the work of system administrators and other people who use networks. And that's all of us.
Now let's move on to the most interesting part - a review of sniffer programs.
We figured out above that they can be made in the form of physical devices, but in most cases special ones are used.
Let's study them.
Sniffer programs
Here is a list of the most popular such programs:
CommView. The program is paid, like everyone else on our list. One minimum license costs $300. But the software has rich functionality. The first thing worth noting is the ability to set rules yourself. For example, you can make sure that (these protocols) are completely ignored. It is also noteworthy that the program allows you to view details and a log of all sent packets. There is a regular version and a Wi-Fi version.

SpyNet. This is, in fact, the Trojan that we are all so tired of. But it can also be used for noble purposes, which we talked about above. The program intercepts and that are in the traffic. There are many unusual functions. For example, you can recreate pages on the Internet that the “victim” visited. It is noteworthy that this software is free, but it is quite difficult to find.

BUTTSniffer. This is a pure sniffer that helps analyze network packets rather than intercept other people's passwords and browser history. At least that's what its author thought. In fact, his creation is used for you know what. This is normal batch program, which works via the command line. To get started, two files are downloaded and launched. “Captured” packets are saved on your hard drive, which is very convenient.
There are many other sniffer programs. For example, fsniff, WinDump, dsniff, NatasX, NetXRay, CooperSniffer, LanExplorer, Net Analyzer and many others are known. Choose any! But, in fairness, it is worth noting that the best is CommView.
So, we have looked at what sniffers are, how they work and what they are like.
Now let's move from the place of a hacker or system administrator to the place of an ordinary user.
We are well aware that our data can be stolen. What can be done to prevent this from happening?
Network packet analyzers, or sniffers, were originally developed as a means of solving network problems. They are able to intercept, interpret and store packets transmitted over the network for subsequent analysis. On the one hand, this allows system administrators and service engineers technical support Observe how data is transferred over the network, diagnose and fix problems that arise. In this sense, packet sniffers are powerful tool diagnosing network problems. On the other hand, like many other powerful tools that were originally intended for administration, over time, sniffers began to be used for completely different purposes. Indeed, a sniffer in the hands of an attacker is a rather dangerous tool and can be used to obtain passwords and other confidential information. However, you should not think that sniffers are some kind of magical tool through which any hacker can easily view confidential information transmitted over the network. And before we prove that the danger posed by sniffers is not as great as is often presented, let us consider in more detail the principles of their functioning.
Operating principles of packet sniffers
Further in this article we will consider only software sniffers designed for Ethernet networks. A sniffer is a program that operates at the NIC (Network Interface Card) network adapter level (link layer) and secretly intercepts all traffic. Since sniffers work on link level OSI model, they do not have to play by the rules of higher-level protocols. Sniffers bypass the filtering mechanisms (addresses, ports, etc.) that Ethernet drivers and the TCP/IP stack use to interpret data. Packet sniffers capture from the wire everything that comes through it. Sniffers can store frames in binary format and later decrypt them to reveal higher-level information hidden inside (Figure 1).

In order for the sniffer to capture all packets passing through the network adapter, the network adapter driver must support promiscuous mode. It is in this mode of operation of the network adapter that the sniffer is able to intercept all packets. This mode of operation of the network adapter is automatically activated when the sniffer is launched or is set manually by the corresponding sniffer settings.
All intercepted traffic is passed to a packet decoder, which identifies and splits packets into the appropriate hierarchy levels. Depending on the capabilities of a particular sniffer, the provided packet information can subsequently be further analyzed and filtered.
Limitations of using sniffers
Sniffers posed the greatest danger in those days when information was transmitted over the network in open form(without encryption), and local networks were built on the basis of concentrators (hubs). However, these days are irrevocably gone, and nowadays the use of sniffers to gain access to confidential information the task is by no means an easy one.
The fact is that when building local networks based on hubs, there is a certain common data transmission medium ( network cable) and all network nodes exchange packets, competing for access to this medium (Fig. 2), and a packet sent by one network node is transmitted to all ports of the hub and this packet is listened to by all other network nodes, but is received only by the node to which it is addressed. Moreover, if a packet sniffer is installed on one of the network nodes, then it can intercept all network packets related to this segment network (network formed by a hub).

Switches are more intelligent devices than broadcast hubs and isolate network traffic. The switch knows the addresses of the devices connected to each port and transmits packets only between the necessary ports. This allows you to offload other ports without having to forward every packet to them, as a hub does. Thus, a packet sent by a certain network node is transmitted only to the switch port to which the packet recipient is connected, and all other network nodes are not able to detect this package(Fig. 3).

Therefore, if the network is built on the basis of a switch, then a sniffer installed on one of the network computers is capable of intercepting only those packets that are exchanged between this computer and other network nodes. As a result, in order to be able to intercept packets that the computer or server of interest to the attacker exchanges with other network nodes, it is necessary to install a sniffer on this particular computer (server), which is actually not so simple. However, you should keep in mind that some packet sniffers are launched from command line and may not have a graphical interface. Such sniffers, in principle, can be installed and launched remotely and unnoticed by the user.
Additionally, you should also keep in mind that while switches isolate network traffic, all managed switches have port forwarding or port mirroring functionality. That is, the switch port can be configured in such a way that all packets arriving on other switch ports are duplicated on it. If in this case a computer with a packet sniffer is connected to such a port, then it can intercept all packets exchanged between computers on a given network segment. However, as a rule, the ability to configure the switch is available only to the network administrator. This, of course, does not mean that he cannot be an attacker, but there are many other ways for a network administrator to control all users local network, and it is unlikely that he will monitor you in such a sophisticated way.
Another reason why sniffers are no longer as dangerous as they once were is that most sensitive data is now transmitted encrypted. Open, unencrypted services are rapidly disappearing from the Internet. For example, when visiting websites, it is increasingly used SSL protocol(Secure Sockets Layer); instead of open FTP SFTP (Secure FTP) is used, and for other services that do not use encryption by default, virtual private networks (VPNs) are increasingly used.
So, those concerned about the potential for malicious use of packet sniffers should keep the following in mind. First, to pose a serious threat to your network, sniffers must be located within the network itself. Secondly, today's encryption standards make it extremely difficult to intercept sensitive information. Therefore, at present, packet sniffers are gradually losing their relevance as hacker tools, but at the same time they remain an effective and powerful tool for diagnosing networks. Moreover, sniffers can be successfully used not only for diagnosing and localizing network problems, but also for auditing network security. In particular, the use of packet analyzers allows you to detect unauthorized traffic, detect and identify unauthorized software, identify unused protocols to remove them from the network, generate traffic for penetration testing (penetration test) to check the security system, work with intrusion detection systems ( Intrusion Detection System (IDS).
Overview of software packet sniffers
All software sniffers can be divided into two categories: sniffers that support launch from the command line, and sniffers that have a graphical interface. However, we note that there are sniffers that combine both of these capabilities. In addition, sniffers differ from each other in the protocols they support, the depth of analysis of intercepted packets, the ability to configure filters, and the possibility of compatibility with other programs.
Typically, the window of any sniffer with a graphical interface consists of three areas. The first of them displays the summary data of intercepted packets. Typically, this area displays a minimum of fields, namely: packet interception time; IP addresses of the packet sender and recipient; MAC addresses of the sender and recipient of the packet, source and destination port addresses; protocol type (network, transport or application layer); some summary information about the intercepted data. In the second area it is displayed statistical information about the individual selected package, and finally in the third area the package is presented in hexadecimal or ASCII character form.
Almost all packet sniffers allow you to analyze decoded packets (which is why packet sniffers are also called packet analyzers, or protocol analyzers). The sniffer distributes intercepted packets across layers and protocols. Some packet sniffers are capable of recognizing the protocol and displaying the captured information. This type of information is usually displayed in the second area of the sniffer window. For example, any sniffer can recognize TCP protocol, and advanced sniffers are able to determine which application generated this traffic. Most protocol analyzers recognize over 500 different protocols and can describe and decode them by name. The more information a sniffer can decode and display on the screen, the less will have to be decoded manually.
One problem that packet sniffers may encounter is the inability to correctly identify a protocol using a port other than the default port. For example, in order to improve security, some famous applications can be configured to use ports other than the default ports. So, instead of the traditional port 80 reserved for the web server, this server You can forcefully reconfigure it to port 8088 or any other. Some packet analyzers in this situation are not able to correctly determine the protocol and display only information about the protocol lower level(TCP or UDP).
There are software sniffers that come with software analytical modules as plugins or built-in modules that allow you to create useful reports. analytical information about intercepted traffic.
Another characteristic feature of most packet analyzer software is the ability to configure filters before and after traffic is captured. Filters select certain packets from the general traffic according to a given criterion, which allows you to get rid of unnecessary information when analyzing traffic.
Original: 8 best packet sniffers and network analyzers
Author: Jon Watson
Date of publication: November 22, 2017
Translation: A. Krivoshey
Transfer date: December 2017
Packet sniffing is a colloquial term that refers to the art of analyzing network traffic. Contrary to popular belief, things like emails and web pages do not travel across the Internet in one piece. They are broken into thousands of small data packets and thus sent over the Internet. In this article we will look at the best free analyzers networks and packet sniffers.
There are many utilities that collect network traffic, and most of them use pcap (on Unix-like systems) or libcap (on Windows) as their core. Another type of utility helps analyze this data, since even a small amount of traffic can generate thousands of packets that are difficult to navigate. Almost all of these utilities differ little from each other in collecting data, the main differences being in how they analyze the data.
Analyzing network traffic requires understanding how the network works. There is no tool that can magically replace an analyst's knowledge of network fundamentals, such as the TCP "3-way handshake" that is used to initiate a connection between two devices. Analysts also need to have some understanding of the types of network traffic on a normally functioning network, such as ARP and DHCP. This knowledge is important because analytics tools will simply show you what you ask them to do. It's up to you to decide what to ask for. If you don't know what your network typically looks like, it can be difficult to know that you've found what you need in the mass of packages you've collected.
The best packet sniffers and network analyzers
Industrial tools
Let's start at the top and then work our way down to the basics. If you're dealing with an enterprise-level network, you'll need a big gun. While almost everything uses tcpdump at its core (more on that later), enterprise-level tools can address certain complex problems such as correlating traffic from multiple servers, providing intelligent queries to identify problems, alerting about exceptions, and creating good charts, which is what management always demands.
Enterprise-level tools are typically geared toward streaming network traffic rather than assessing the contents of packets. By this I mean that the main focus of most system administrators in the enterprise is to ensure that the network does not have performance bottlenecks. When such bottlenecks occur, the goal is usually to determine whether the problem is caused by the network or by an application on the network. On the other hand, these tools can usually handle so much traffic that they can help predict when a network segment will be fully loaded, a critical point in managing network bandwidth.
This is a very large set of IT management tools. In this article, the Deep Packet Inspection and Analysis utility, which is its integral part. Collecting network traffic is quite simple. With tools like WireShark, basic analysis is also not a problem. But the situation is not always completely clear. On a very busy network, it can be difficult to determine even very simple things, such as:
What application on the network is generating this traffic?
- if an application is known (say a web browser), where do its users spend most of their time?
- which connections are the longest and overload the network?
Most network devices use each packet's metadata to make sure the packet goes where it needs to go. The contents of the packet are unknown to the network device. Another thing is deep packet inspection; this means that the actual contents of the package are checked. In this way, critical network information that cannot be gleaned from metadata can be discovered. Tools, similar topics, which are provided by SolarWinds, can provide more meaningful data than just traffic flow.

Other technologies for managing data-intensive networks include NetFlow and sFlow. Each has its own strengths and weaknesses,
You can learn more about NetFlow and sFlow.
Network analysis in general is an advanced topic that is based on both acquired knowledge and practical experience work. You can train a person to have detailed knowledge of network packets, but unless that person has knowledge of the network itself and experience identifying anomalies, they won't do very well. The tools described in this article should be used by experienced network administrators who know what they want but are not sure which utility is best. They can also be used by less experienced system administrators to gain day-to-day networking experience.
Basics
The main tool for collecting network traffic is
This application is open source code, which is installed on almost all Unix-like operating systems. Tcpdump - great utility for data collection, which has a very complex filtering language. It is important to know how to filter data when collecting it in order to end up with a normal set of data for analysis. Capturing all the data from a network device, even on a moderately busy network, can generate too much data that is very difficult to analyze.
In some in rare cases It will be enough to display the data captured by tcpdump directly on the screen to find what you need. For example, while writing this article, I collected traffic and noticed that my machine was sending traffic to an IP address that I didn't know. It turns out that my machine was sending data to Google IP address 172.217.11.142. Since I didn't have any Google products and Gmail wasn't open, I didn't know why this was happening. I checked my system and found the following:
[ ~ ]$ ps -ef | grep google user 1985 1881 0 10:16 ? 00:00:00 /opt/google/chrome/chrome --type=service
It turns out that even when Chrome is not running, it remains running as a service. I wouldn't have noticed this without packet analysis. I captured a few more data packets, but this time I gave tcpdump the task of writing the data to a file, which I then opened in Wireshark (more on this later). These are the entries:

Tcpdump is a favorite tool of system administrators because it is a command line utility. Running tcpdump does not require a GUI. For production servers, the graphical interface is rather harmful, since it consumes system resources, so command line programs are preferred. Like many modern utilities, tcpdump has a very rich and complex language that takes some time to master. Several of the most basic commands involve selecting a network interface to collect data and recording that data to a file so it can be exported for analysis elsewhere. The -i and -w switches are used for this.
# tcpdump -i eth0 -w tcpdump_packets tcpdump: listening on eth0, link-type EN10MB (Ethernet), capture size 262144 bytes ^C51 packets captured
This command creates a file with the captured data:
File tcpdump_packets tcpdump_packets: tcpdump capture file (little-endian) - version 2.4 (Ethernet, capture length 262144)
The standard for such files is the pcap format. It is not text, so it can only be analyzed using programs that understand this format.
3.Windump
Majority useful utilities open source eventually gets cloned into other operating systems. When this happens, the application is said to have been migrated. Windump is a port of tcpdump and behaves in a very similar way.
The most significant difference between Windump and tcpdump is that Windump needs the Winpcap library installed before Windump runs. Even though Windump and Winpcap are provided by the same maintainer, they must be downloaded separately.
Winpcap is a library that must be pre-installed. But Windump is an exe file that doesn't need to be installed, so you can just run it. This is something to keep in mind if you are using a Windows network. You don't have to install Windump on every machine as you can just copy it as needed, but you will need Winpcap to support Windup.
As with tcpdump, Windump can display network data for analysis, filter it in the same way, and also write the data to a pcap file for later analysis.
4. Wireshark
Wireshark is the next most famous tool in a system administrator's toolbox. It not only allows you to capture data but also provides some advanced analysis tools. Additionally, Wireshark is open source and has been ported to almost all existing server operating systems. Called Etheral, Wireshark now runs everywhere, including as a standalone, portable application.
If you're analyzing traffic on a server with a GUI, Wireshark can do everything for you. It can collect data and then analyze it all right there. However, GUIs are rare on servers, so you can collect network data remotely and then examine the resulting pcap file in Wireshark on your computer.
When you first launch Wireshark, you can either download existing file pcap, or start traffic capture. IN the latter case You can optionally set filters to reduce the amount of data collected. If you don't specify a filter, Wireshark will simply collect all network data from the selected interface.

One of the most useful features Wireshark is the ability to follow a stream. It's best to think of a thread as a chain. In the screenshot below we can see a lot of data captured, but what I was most interested in was Google's IP address. I can click right click mouse and follow the TCP stream to see the entire chain.

If the traffic was captured on another computer, you can import the PCAP file using the Wireshark File -> Open dialog. The same filters and tools are available for imported files as for captured network data.

5.tshark
Tshark is a very useful link between tcpdump and Wireshark. Tcpdump is superior at data collection and can surgically extract only the data you need, however its data analysis capabilities are very limited. Wireshark is great at both capture and analysis, but has a heavy user interface and cannot be used on servers without a GUI. Try tshark, it works on the command line.
Tshark uses the same filtering rules as Wireshark, which should not be surprising since they are essentially the same product. The command below only tells tshark to capture the destination IP address, as well as some other fields of interest from the HTTP portion of the packet.
# tshark -i eth0 -Y http.request -T fields -e ip.dst -e http.user_agent -e http.request.uri 172.20.0.122 Mozilla/5.0 (X11; Linux x86_64; rv:57.0) Gecko/20100101 Firefox /57.0 /images/title.png 172.20.0.122 Mozilla/5.0 (X11; Linux x86_64; rv:57.0) Gecko/20100101 Firefox/57.0 /images/styles/phoenix.css 172.20.0.122 Mozilla/5.0 (X11; Linux x86_64; rv:57.0) Gecko/20100101 Firefox/57.0 /images/code/jquery_lightbox/jquery_lightbox/js/jquery-1.2.6.pack.js 172.20.0.122 Mozilla/5.0 (X11; Linux x86_64; rv:57.0) Gecko/20100101 Firefox /57.0 /images/styles/index.css 172.20.0.122 Mozilla/5.0 (X11; Linux x86_64; rv:57.0) Gecko/20100101 Firefox/57.0 /images/images/title.png 172.20.0.122 Mozilla/5.0 (X11; Linux x86_64; rv:57.0) Gecko/20100101 Firefox/57.0 /favicon.ico 172.20.0.122 Mozilla/5.0 (X11; Linux x86_64; rv:57.0) Gecko/20100101 Firefox/57.0 /favicon.ico
If you want to write traffic to a file, use the -W option to do so, and then the -r (read) switch to read it.
First capture:
# tshark -i eth0 -w tshark_packets Capturing on "eth0" 102 ^C
Read it here, or move it to another place for analysis.
# tshark -r tshark_packets -Y http.request -T fields -e ip.dst -e http.user_agent -e http.request.uri 172.20.0.122 Mozilla/5.0 (X11; Linux x86_64; rv:57.0) Gecko/20100101 Firefox /57.0 /contact 172.20.0.122 Mozilla/5.0 (X11; Linux x86_64; rv:57.0) Gecko/20100101 Firefox/57.0 /reservations/ 172.20.0.122 Mozilla/5.0 (X11; Linux x86_64; rv:57.0) 00101 Firefox/ 57.0 /reservations/styles/styles.css 172.20.0.122 Mozilla/5.0 (X11; Linux x86_64; rv:57.0) Gecko/20100101 Firefox/57.0 /res/code/jquery_lightbox/jquery_lightbox/js/jquery-1.2.6.pack. js 172.20.0.122 Mozilla/5.0 (X11; Linux x86_64; rv:57.0) Gecko/20100101 Firefox/57.0 /res/styles/index.css 172.20.0.122 Mozilla/5.0 (X11; Linux x86_64; rv:57.0) 00101 Firefox/57.0 /res/images/title.png
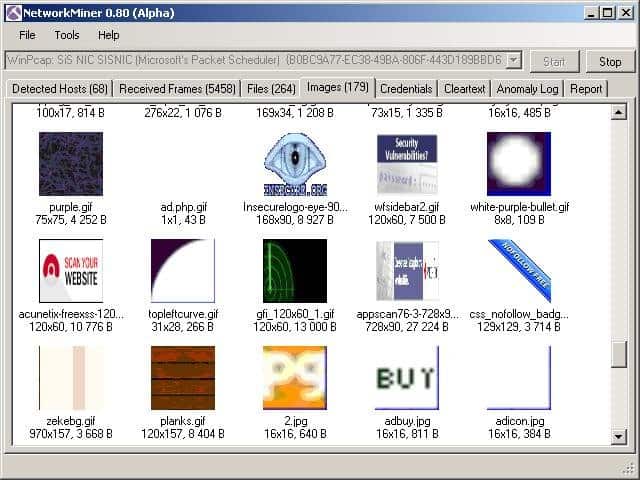
This is a very interesting tool that falls more into the category of network forensic analysis tools rather than just sniffers. The field of forensics typically deals with investigations and evidence collection, and Network Miner does this job just fine. Just as wireshark can follow a TCP stream to reconstruct an entire packet transmission chain, Network Miner can follow a stream in order to recover files that have been transferred over a network.
Network Miner can be strategically placed on the network to be able to observe and collect traffic that interests you in real time. It will not generate its own traffic on the network, so it will operate covertly.
Network Miner can also work in offline mode. You can use tcpdump to collect packets at a network point of interest and then import the PCAP files into Network Miner. Next, you can try to recover any files or certificates found in the recorded file.
Network Miner is made for Windows, but with Mono it can be run on any OS that supports the Mono platform, such as Linux and MacOS.
There is a free version entry level, but with a decent set of functions. If you need additional features, such as geolocation and custom scripts, you will need to purchase a professional license.
7. Fiddler (HTTP)
It's not technically a network packet capture utility, but it's so incredibly useful that it makes it onto this list. Unlike the other tools listed here, which are designed to capture network traffic from any source, Fiddler is more of a debugging tool. It captures HTTP traffic. While many browsers already have this capability in their developer tools, Fiddler is not limited to browser traffic. Fiddler can capture any HTTP traffic on a computer, including non-web applications.

Many desktop applications use HTTP to connect to web services, and in addition to Fiddler, the only way Capturing such traffic for analysis is to use tools such as tcpdump or Wireshark. However, they operate at the packet level, so analysis requires reconstructing these packets into HTTP streams. This may require a lot of work to complete. simple research and this is where Fiddler comes to the rescue. Fiddler will help you detect cookies, certificates, and other useful data sent by applications.
Fiddler is free and, like Network Miner, it can be run in Mono on almost any operating system.
8. Capsa
The Capsa network analyzer has several editions, each with different capabilities. At the first level, Capsa is free, and it essentially allows you to simply capture packets and perform basic graphical analysis on them. The dashboard is unique and can help an inexperienced system administrator quickly identify network problems. Free level is designed for people who want to learn more about packages and build their analysis skills.

The free version allows you to control more than 300 protocols, suitable for monitoring email, as well as saving email content, it also supports triggers that can be used to trigger alerts when certain situations occur. In this regard, Capsa can be used as a support tool to some extent.
Capsa is only available for Windows 2008/Vista/7/8 and 10.
Conclusion
It is easy to understand how, using the tools we have described, a system administrator can create a network monitoring infrastructure. Tcpdump or Windump can be installed on all servers. Scheduler such as cron or Windows scheduler, V right moment starts a packet collection session and writes the collected data to a pcap file. The system administrator can then transfer these packets to the central machine and analyze them using wireshark. If the network is too large for this, enterprise-grade tools such as SolarWinds are available to turn all network packets into a manageable data set.
Read other articles about intercepting and analyzing network traffic :
- Dan Nanni, Command Line Utilities for Monitoring Network Traffic on Linux
- Paul Cobbaut, Linux System Administration. Intercepting network traffic
- Paul Ferrill, 5 Tools for Network Monitoring on Linux
- Pankaj Tanwar, Packet capture using libpcap library
- Riccardo Capecchi, Using filters in Wireshark
- Nathan Willis, Network Analysis with Wireshark
- Prashant Phatak,
Each member of the ][ team has their own preferences regarding software and utilities for
pen test. After consulting, we found out that the choice varies so much that it is possible
create a real gentleman's set of proven programs. That's it
decided. In order not to make a hodgepodge, we divided the entire list into topics - and in
This time we’ll touch on utilities for sniffing and manipulating packets. Use it on
health.
Wireshark
Netcat
If we talk about data interception, then Network Miner will be taken off the air
(or from a pre-prepared dump in PCAP format) files, certificates,
images and other media, as well as passwords and other information for authorization.
A useful feature is to search for those pieces of data that contain keywords
(for example, user login).
Scapy
Website:
www.secdev.org/projects/scapy
A must-have for any hacker, it is a powerful tool for
interactive packet manipulation. Receive and decode packets of the most
different protocols, answer the request, inject the modified and
a package created by yourself - everything is easy! With its help you can perform a whole
a number of classic tasks such as scanning, tracorute, attacks and detection
network infrastructure. In one bottle we get a replacement for such popular utilities,
like: hping, nmap, arpspoof, arp-sk, arping, tcpdump, tetheral, p0f, etc. At that
it's about time Scapy allows you to perform any task, even the most specific
a task that can never be done by another developer already created
means. Instead of writing a whole mountain of lines in C to, for example,
generating the wrong packet and fuzzing some daemon is enough
throw in a couple of lines of code using Scapy! The program does not have
graphical interface, and interactivity is achieved through the interpreter
Python. Once you get the hang of it, it won’t cost you anything to create incorrect
packets, inject the necessary 802.11 frames, combine different approaches in attacks
(say, ARP cache poisoning and VLAN hopping), etc. The developers themselves insist
to ensure that Scapy's capabilities are used in other projects. Connecting it
as a module, it’s easy to create a utility for various types of local area research,
search for vulnerabilities, Wi-Fi injection, automatic execution of specific
tasks, etc.
packeth
Website:
Platform: *nix, there is a port for Windows
An interesting development that allows, on the one hand, to generate any
ethernet packet, and, on the other hand, send sequences of packets with the purpose
checks bandwidth. Unlike other similar tools, packeth
has a graphical interface, allowing you to create packages in the most simple way
form. Further - more. The creation and sending are especially elaborated
sequences of packets. You can set delays between sending,
send packets at maximum speed to test throughput
section of the network (yep, this is where they’ll be filing) and, what’s even more interesting -
dynamically change parameters in packets (for example, IP or MAC address).
OVERVIEW OF NETWORK TRAFFIC ANALYSIS AND MONITORING PROGRAMS
A.I. KOSTROMITSKY, Ph.D. tech. Sciences, V.S. DRILL
Introduction
Traffic monitoring is vital for effective management network. It is a source of information about the functioning of corporate applications, which is taken into account when allocating funds, planning computing power, identifying and localizing failures, and resolving security issues.
In the not-too-distant past, traffic monitoring was a relatively simple task. As a rule, computers were networked based on a bus topology, i.e., they had a shared transmission medium. This allowed a single device to be connected to the network, with which all traffic could be monitored. However, demands for increased network capacity and the development of packet switching technologies, which caused a drop in prices for switches and routers, determined quick transition from shared media to highly segmented topologies. The overall traffic can no longer be seen from one point. To get a complete picture, you need to monitor each port. Using point-to-point connections makes connecting devices inconvenient and would require too many devices to listen to all ports, which becomes a prohibitively expensive task. In addition, switches and routers themselves have complex architectures, and the speed of packet processing and transmission becomes important factor, which determines network performance.
One of the current scientific tasks is the analysis (and further prediction) of the self-similar traffic structure in modern multiservice networks. To solve this problem, it is necessary to collect and subsequently analyze various statistics (speed, volumes of transmitted data, etc.) in existing networks. Collection of such statistics in one form or another is possible in various ways. software. However, there is a set of additional parameters and settings that turn out to be very important when using various tools in practice.
Various researchers use the most various programs to monitor network traffic. For example, in , researchers used the Ethreal network traffic analyzer (sniffer) program (Wireshark).
Reviewed free versions programs that are available on , , .
1. Overview of network traffic monitoring programs
We reviewed about ten traffic analyzer programs (sniffers) and more than a dozen programs for monitoring network traffic, from which we selected the four most interesting, in our opinion, and offer you an overview of their main capabilities.
1) BMExtreme(Fig. 1).
This is the new name of the well-known Bandwidth Monitor program. Previously, the program was distributed free of charge, but now it has three versions, and only the basic one is free. This version does not provide any features other than traffic monitoring itself, so it can hardly be considered a competitor to other programs. By default, BMExtreme monitors both Internet traffic and traffic on the local network, but monitoring on the LAN can be disabled if desired.
Rice. 1
2) BWMeter(Fig. 2).
This program has not one, but two traffic tracking windows: one displays activity on the Internet, and the other on the local network.

Rice. 2
The program has flexible settings for traffic monitoring. With its help, you can determine whether you need to monitor the reception and transmission of data on the Internet only from this computer or from all computers connected to the local network, set the range of IP addresses, ports and protocols for which monitoring will or will not be carried out. In addition, you can disable traffic tracking during certain hours or days. System administrators They will certainly appreciate the ability to distribute traffic between computers on a local network. Thus, for each PC you can set the maximum speed for receiving and transmitting data, and also prohibit network activity with one click.
Despite its very miniature size, the program has a huge variety of capabilities, some of which can be represented as follows:
Monitoring any network interfaces and any network traffic.
A powerful filter system that allows you to estimate the volume of any part of the traffic - up to a specific site in a specified direction or traffic from each machine on the local network in specified time days.
Unlimited number of customizable activity charts network connections based on selected filters.
Control (limit, pause) traffic flow on any of the filters.
Convenient statistics system (from an hour to a year) with an export function.
Ability to view statistics remote computers with BWMeter.
Flexible system of alerts and notifications upon reaching a certain event.
Maximum customization options, incl. appearance.
Possibility to run as a service.
3) Bandwidth Monitor Pro(Fig. 3).
Its developers paid a lot of attention to setting up the traffic monitoring window. Firstly, you can determine what information the program will constantly display on the screen. This can be the amount of data received and transmitted (both separately and in total) for today and for any specified period of time, average, current and maximum connection speed. If you have multiple network adapters installed, you can monitor statistics for each of them separately. At the same time, necessary information for each network card can also be displayed in the monitoring window.

Rice. 3
Separately, it is worth mentioning the notification system, which is implemented very successfully here. You can set the behavior of the program when specified conditions are met, which may be the transfer of a certain amount of data over a specified period of time, achievement maximum speed downloads, changing the connection speed, etc. If several users work on the computer and you need to monitor the overall traffic, the program can be run as a service. In this case, Bandwidth Monitor Pro will collect statistics of all users who log into the system under their logins.
4) DUTraffic(Fig. 4).
DUTraffic is distinguished from all review programs by its free status.

Rice. 4
Like its commercial counterparts, DUTraffic can perform a variety of actions when certain conditions are met. For example, it can play an audio file, show a message, or break the Internet connection when the average or current download speed is slower set value, when the duration of the Internet session exceeds the specified number of hours, when a certain amount of data is transferred. Besides this, various actions can be executed cyclically, for example, every time the program records the transfer of a given amount of information. Statistics in DUTraffic are maintained separately for each user and for each Internet connection. The program shows both general statistics for the selected period of time and information about the speed, amount of transmitted and received data and financial costs for each session.
5) Cacti monitoring system(Fig. 5).
Cacti is an open-source web application (there is no installation file). Cacti collects statistical data for specific time intervals and allows you to display them in graphical form. The system allows you to build graphs using RRDtool. Mainly used standard templates to display statistics on processor load, RAM allocation, number of running processes, use of incoming/outgoing traffic.
The interface for displaying statistics collected from network devices is presented in the form of a tree, the structure of which is specified by the user. As a rule, graphs are grouped according to certain criteria, and the same graph can be present in different branches of the tree (for example, traffic through the server’s network interface - in the one dedicated to the overall picture of the company’s Internet traffic, and in the branch with parameters of this device). There is an option to view a pre-compiled set of charts, and there is a preview mode. Each of the graphs can be viewed separately, and it will be presented for the last day, week, month and year. There is a possibility independent choice the time period for which the graph will be generated, and this can be done either by specifying calendar parameters or simply by selecting a certain area on it with the mouse.

Table 1
|
Settings/Programs |
BMExtreme |
BWMeter |
Bandwidth Monitor Pro |
DUTraffic |
Cacti |
|
Installation file size |
473 KB |
1.91 MB |
1.05 MB |
1.4 MB |
|
|
Interface language |
Russian |
Russian |
English |
Russian |
English |
|
Speed graph |
|||||
|
Traffic graph |
|||||
|
Export/Import (export file format) |
–/– |
(*. csv) |
–/– |
–/– |
(*.xls) |
|
Min -time step between data reports |
5 min. |
1 sec. |
1 min. |
1 sec. |
1 sec. |
|
Possibility of change min |
|||||
2. Review of network traffic analyzer programs (sniffers)
A traffic analyzer, or sniffer, is a network traffic analyzer, a program or hardware and software device designed to intercept and subsequently analyze, or only analyze, network traffic intended for other nodes.
Analysis of traffic passed through the sniffer allows you to:
Intercept any unencrypted (and sometimes encrypted) user traffic in order to obtain passwords and other information.
Locate a network fault or network agent configuration error (sniffers are often used for this purpose by system administrators).
Since in a “classic” sniffer traffic analysis is carried out manually, using only the simplest automation tools (protocol analysis, TCP stream restoration), it is suitable for analyzing only small volumes.
1) Wireshark(formerly Ethereal).
Traffic analyzer program for computer networks Ethernet and some others. Has a graphical user interface. Wireshark is an application that “knows” the structure of a wide variety of network protocols, and therefore allows you to parse a network packet, displaying the value of each protocol field at any level. Since pcap is used to capture packets, it is possible to capture data only from networks that are supported by this library. However, Wireshark can handle a variety of input data formats, so you can open data files captured by other programs, expanding your capture capabilities.
2) IrisNetworkTrafficAnalyzer.
In addition to the standard functions of collecting, filtering and searching for packages, as well as generating reports, the program offers unique capabilities for reconstructing data. Iris The Network Traffic Analyzer helps to reproduce in detail user sessions with various web resources and even allows you to simulate the sending of passwords to access secure web servers using cookies. The unique data reconstruction technology implemented in the decryption module converts hundreds of collected binary network packets into familiar emails, web pages, ICQ messages, etc. eEye Iris allows you to view unencrypted messages from web mail and instant messaging programs, expanding the capabilities of existing monitoring and audit tools.
The eEye Iris packet analyzer allows you to capture various details of the attack, such as the date and time, IP addresses and DNS names of the hacker and victim's computers, and the ports used.
3) EthernetInternettrafficStatistic.
Ethernet Internet traffic Statistic shows the amount of data received and received (in bytes - total and for the last session), as well as the connection speed. For clarity, the collected data is displayed in real time on a graph. It works without installation, the interface is Russian and English.
A utility for monitoring the degree of network activity - shows the amount of received and accepted data, keeping statistics for the session, day, week and month.
4) CommTraffic.
This is a network utility for collecting, processing and displaying Internet traffic statistics via a modem (dial-up) or dedicated connection. When monitoring a local network segment, CommTraffic shows Internet traffic for each computer in the segment.
CommTraffic includes highly customizable, user friendly an interface showing network performance statistics in the form of graphs and numbers.
Table 2
|
Settings/Programs |
Wireshark |
Iris The Network Traffic Analyzer |
Ethernet Internet traffic Statistic |
CommTraffic |
|
Installation file size |
17.4 MB |
5.04 MB |
651 KB |
7.2 MB |
|
Interface language |
English |
Russian |
English/Russian |
Russian |
|
Speed graph |
||||
|
Traffic graph |
||||
|
Export/Import (export file format) |
+/– (*.txt, *.px, *.csv, *.psml, *.pdml, *.c) |
–/– |
–/– |
–/– |
|
Run on-demand monitoring |
||||
|
Min -time step between data reports |
0.001 sec. |
1 sec. |
1 sec. |
1 sec. |
|
Possibility of change min -th step between data reports |
Conclusion
Overall, we can say that most home users will be satisfied with the capabilities that Bandwidth Monitor Pro provides. If we talk about the most functional program for monitoring network traffic, this is, of course, BWMeter.
Among the network traffic analyzer programs considered, I would like to highlight Wireshark, which has more functionality.
The Cacti monitoring system maximally meets the increased requirements that are imposed when conducting research on network traffic for scientific purposes. In the future, the authors of the article plan to use this particular system for collecting and preliminary analysis of traffic in the corporate multiservice network of the Department of Communication Networks of Kharkov University national university radio electronics.
References
Platov V.V., Petrov V.V. Study of the self-similar structure of teletraffic in a wireless network // Radio engineering notebooks. M.: OKB MPEI. 2004. No. 3. pp. 58-62.
Petrov V.V. Teletraffic structure and algorithm for ensuring quality of service under the influence of the self-similarity effect. Dissertation for the scientific degree of Candidate of Technical Sciences, 05.12.13, Moscow, 2004, 199 p.